

ExactFlow Home Page User Guide
ExactFlow is the perfect one-stop solution for managing orders, products, inventory, and performance across several eCommerce marketplaces.
Your primary dashboard is the Home Page. It provides a brief summary of your company's performance. Each section of the Home Page is explained in this guide:
-
Top Header Bar
Every page has the taskbar at the top. Important features like search, language, notifications, theme settings, and your account profile are easily accessible

From left to right, the following is a brief description of each icon:
-
ExactFlow Logo
-
You can return to the Home Dashboard by clicking the ExactFlow logo.
-
It functions as a fast reset button that brings up the main screen.
-
-
Search Bar
-
The search bar lets you quickly find anything on the platform. This helps you find items faster without having to browse menus.
-
You can swiftly look up anything on the platform using the search bar. This facilitates you in finding items quickly without the need to browse menus.
-
You can look up orders, products, SKUs, clients, and marketplaces.
-
The shortcut displayed is Ctrl + K (Windows) or ⌘ + K (Mac).
-
-
Magic/AI Icon
OpenAI Assistant features are included. It is helpful when you need rapid automation or AI-powered guidance. It helps in:
-
Automated suggestions
-
AI-generated insights
-
Smart assistance tools
-
-
Language Icon
-
It is helpful if team members speak different languages.
-
It enables you to change ExactFlow's display language. English, French, Polish, German, Spanish, and Italian are among these languages.
-
-
Light/Dark Mode Theme Icon
-
Switch between the Light Mode and Dark Mode.
-
Select the theme that is more aesthetically pleasing to you.
-
-
Feature/Module Star Icon
You can easily access the features you use the most.
-
Open the Shortcuts/Quick Access menu.
-
This menu could consist of:
-
Calendar
-
Role & Permissions
-
Products
-
Orders
-
Invoices
-
-
Notifications Bell
It enables you to respond quickly to important events.
-
It displays all your recent notifications.
-
You have unread alerts if you have a red badge with a number on it.
-
Notifications may include:.
-
New orders
-
Errors or warnings
-
System updates
-
Integration alerts
-
-
User Profile Icon
It displays your name, email, and designation with your account picture. A small green dot indicates that you are active and online right now. When you click it, it opens:
-
My Account
-
Roles & Permissions
-
Users & Employees
-
Log out
-
-
-
Left Sidebar Menu
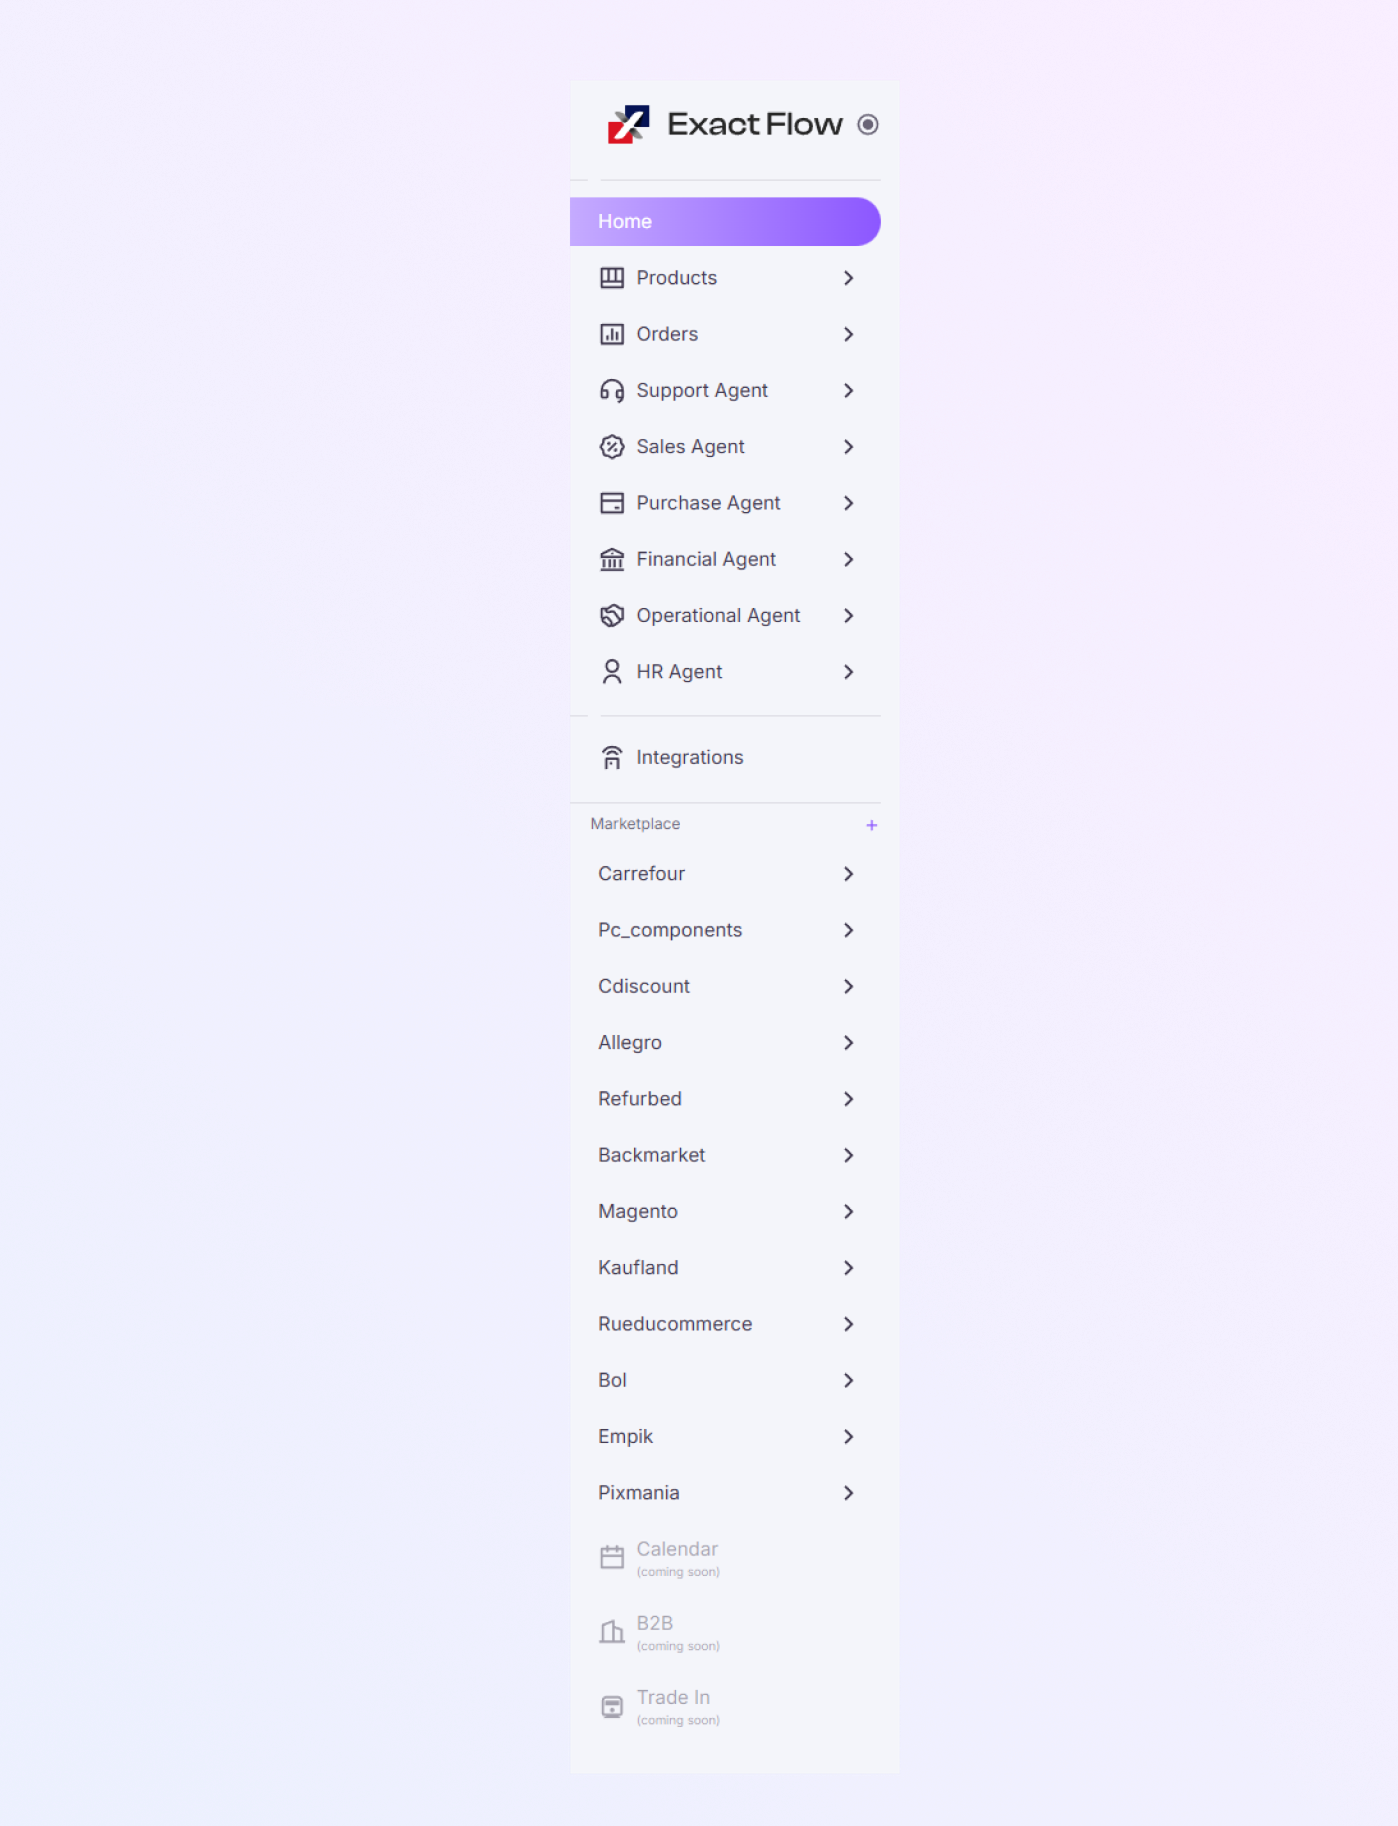
This is a primary navigation panel. It remains on your screen's left side.
-
Main Sections.
-
Home: Returns you to this dashboard.
-
Products: Keep track of and access all of your product listings.
-
Orders: Verify and handle every order placed by customers.
-
Support agent: Handled customer service tickets.
-
Purchase Agent: Oversee purchase orders and suppliers.
-
Financial Agent: View financial summaries and profit/loss statements.
-
Operational Agent: Tools for automating workflows.
-
AI Agent: Intelligent AI capabilities for automation.
-
Page Rank: Campaign and ranking metrics are included here.
-
Integrations: Link online retailers such as Amazon, eBay, Etsy, Allegro, and others.
-
-
Each marketplace has a logo that you can click to view its data. Backmarket refurbished PC components, Allegro on Amazon, Cdiscount, FNAC, Etsy OnBuy are a few examples.
-
You can easily access platform-specific reports in this section.
-
-
Welcome Message
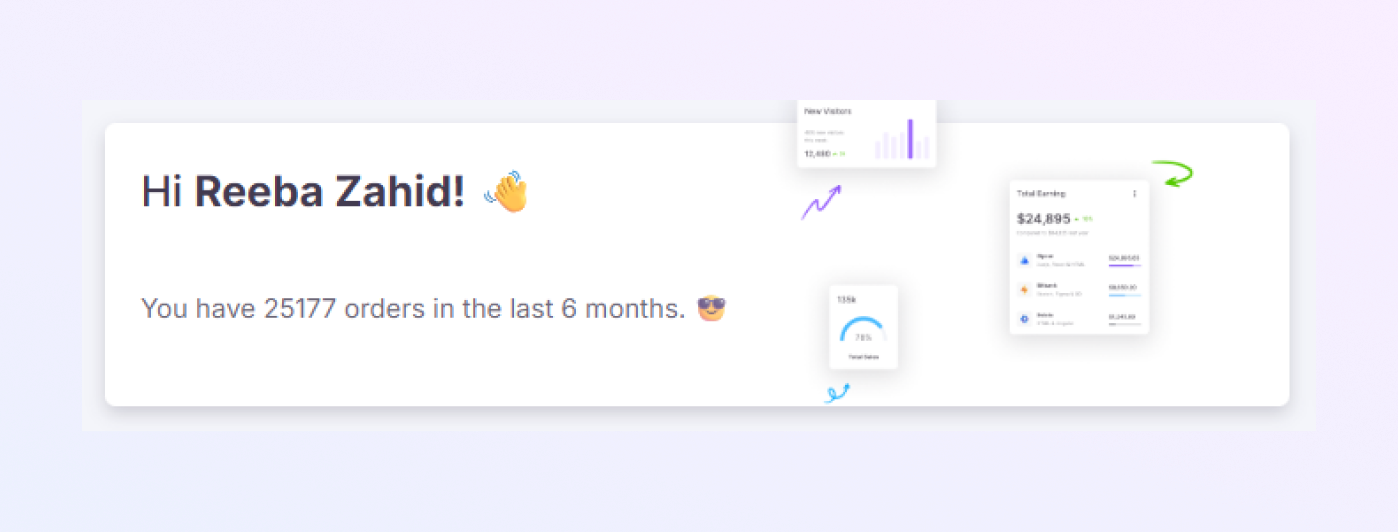
At the top-left area, you see:
-
You see: Greeting with your name in the upper-left corner
-
Quick statistics, such as:
-
Total orders placed in the last six months
-
A small icon/image related to achievements
-
When you log in, this provides you with a welcoming and customized view
-
-
Total Profit (Graph Section)
-
The monthly financial performance is displayed in this chart.
-
Every bar has several colours that stand for
-
Total Revenue
-
Total Profit
-
Total Expenses
-
-
Coloured bar charts allow you to compare performance from month to month.
-
It helps you understand:
-
If profits are increasing
-
If spending is under control
-
Which months performed better
-
-
-
Main Business Overview Cards (Top-Right)
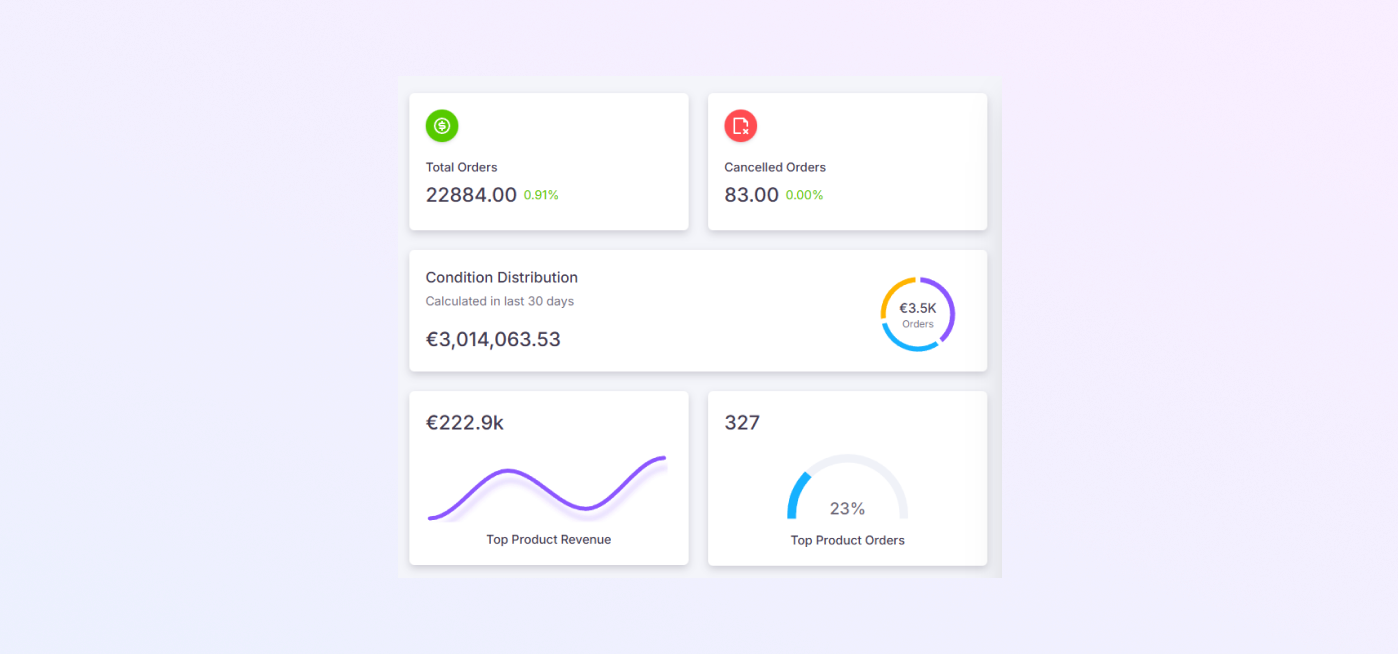
Your important business numbers are displayed on these cards:
-
Total Orders
-
The total number of orders you received from all marketplaces is displayed in this section.You can return to the Home Dashboard by clicking the ExactFlow logo.
-
Growth or decline is indicated by a green or red percentage.
-
-
Cancelled Orders
This section helps in identifying problems that impact customer satisfaction. It displays:
-
Number of cancelled orders.
-
Percentage change.
-
-
Condition Distribution
You can determine whether recent sales have improved by looking at this section. The revenue for the previous 30 days is displayed.
-
Top Product Revenue
This section helps to identify seasonal performance. A line graph showing your best-selling product's revenue trend.
-
Top Product Orders
You can see your strongest item in this section. It displays the percentage of total orders it represents, as well as the number of top product orders.
-
-
Transactions Section (Left-Middle)
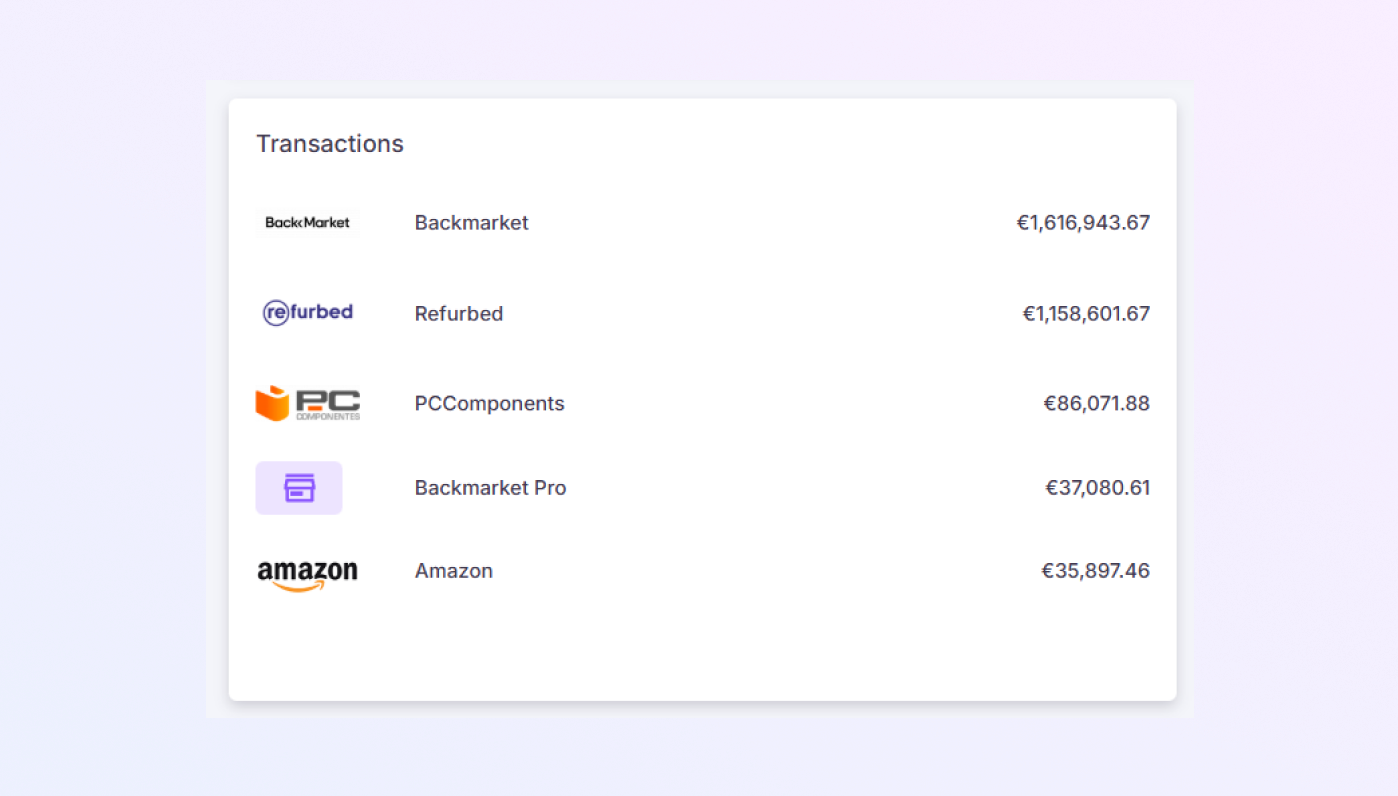
This section helps in comparing the top-performing platforms. Additionally helpful when developing pricing or expansion plans. It displays a comprehensive list of every marketplace along with revenue figures. As you can see:
-
Name and logo of the marketplace.
-
Total revenue from every marketplace
-
Examples:
-
Backmarket: € value
-
Refurbed: € value
-
Amazon: € value
-
Allegro: € value
-
Cdiscount: € value
-
Etsy: € value
-
You can quickly see where most sales come from.
-
-
Total Revenue + Average Order Value (Middle Center)
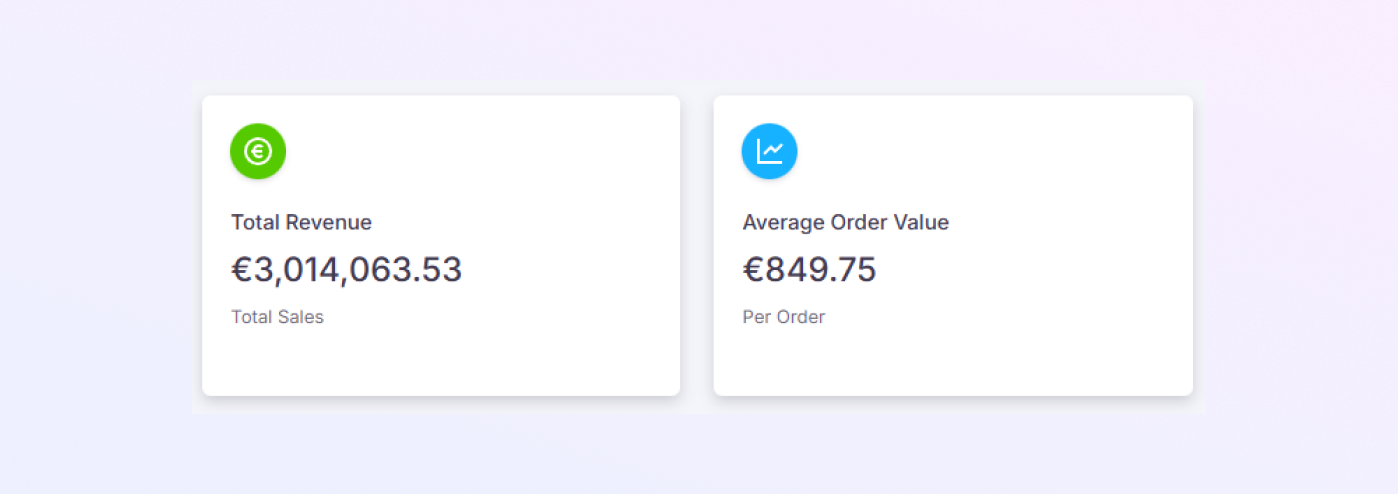
These two number widgets are crucial. These numbers help to measure your overall performance quality.
-
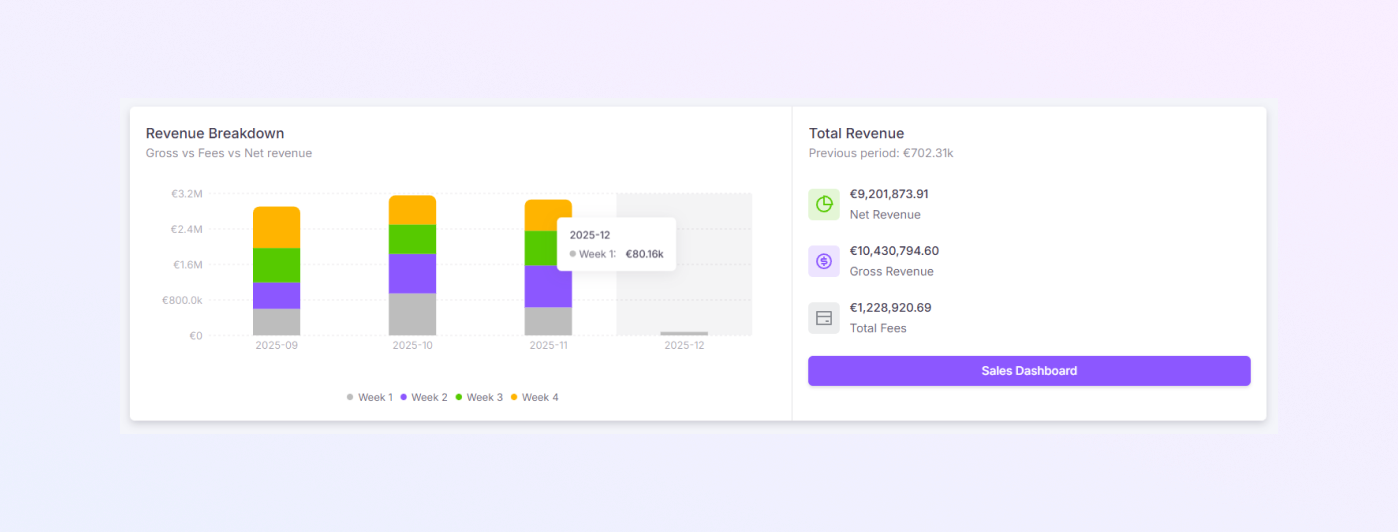
Total Revenue: This indicates the total amount of money your store earned. And it originates from the sum of all linked marketplaces.
-
Average Order Value (AOV): This section helps to understand purchasing behaviour. The average amount spent on each order is displayed.
-
-
Type of Problems Analysis
-
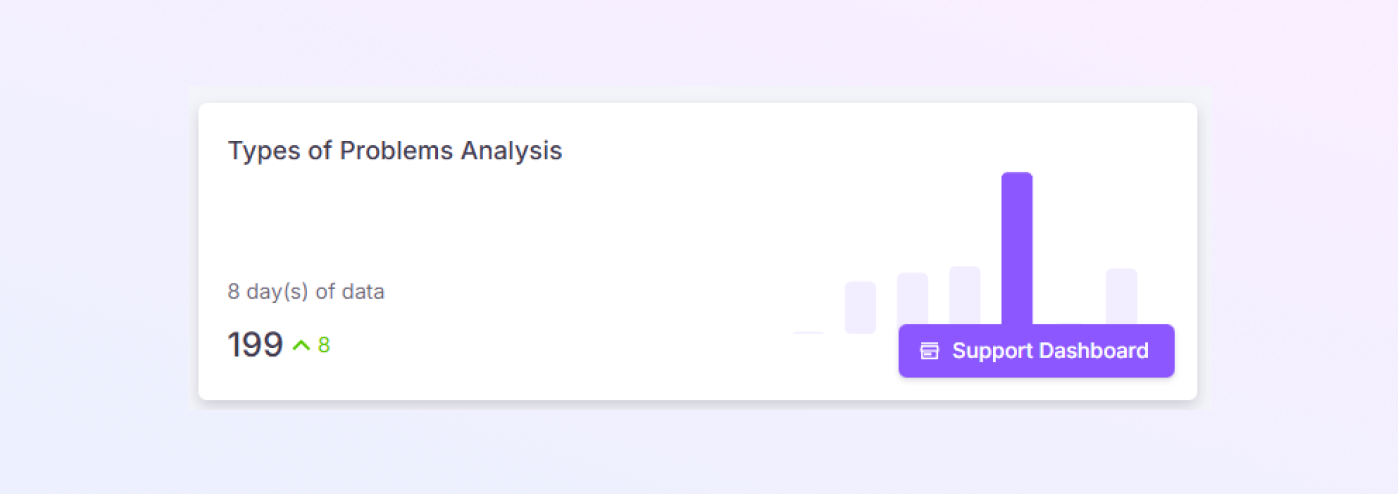
Operational monitoring is done in this section. It displays the total number of operational issues over the last seven days (e.g., 109). Issues could include:
-
Stock errors
-
Missing tracking
-
Order delays
-
Listing issues
-
-
A mini bar graph that displays problem trends is also included. Click "Support Dashboard" to view additional information.
-
-
Marketplace Orders (Right-Middle Section)
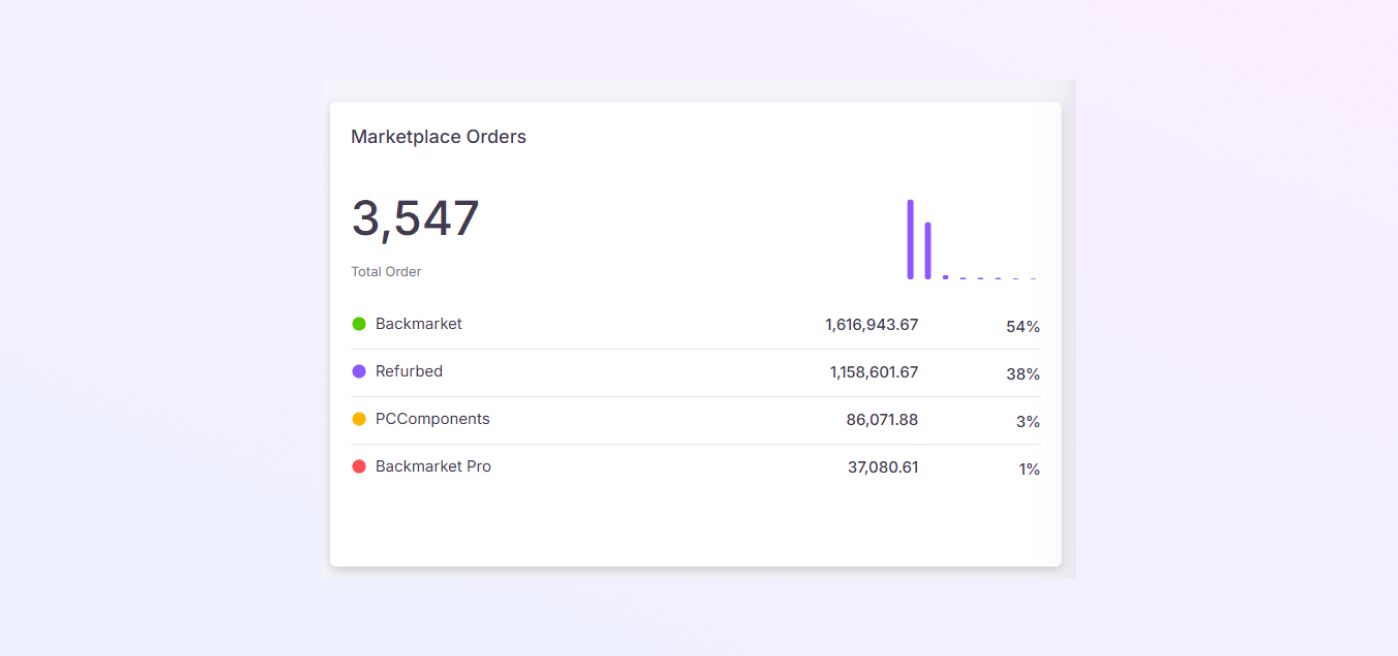
This section facilitates revenue-based marketplace comparisons. It displays:
-
Total revenue from the marketplace
-
A list of marketplaces with:
-
Revenue
-
Percentage share
-
-
Platform ranking is displayed in a vertical bar graph. Example:
-
Backmarket: 54%
-
Refurbed: 28%
-
PC Components: 3%
-
Rumarka: 1%
-
-
Each platform's contribution to your overall sales is displayed as a percentage.
-
-
Recent Orders (Bottom-Middle Panel)
-
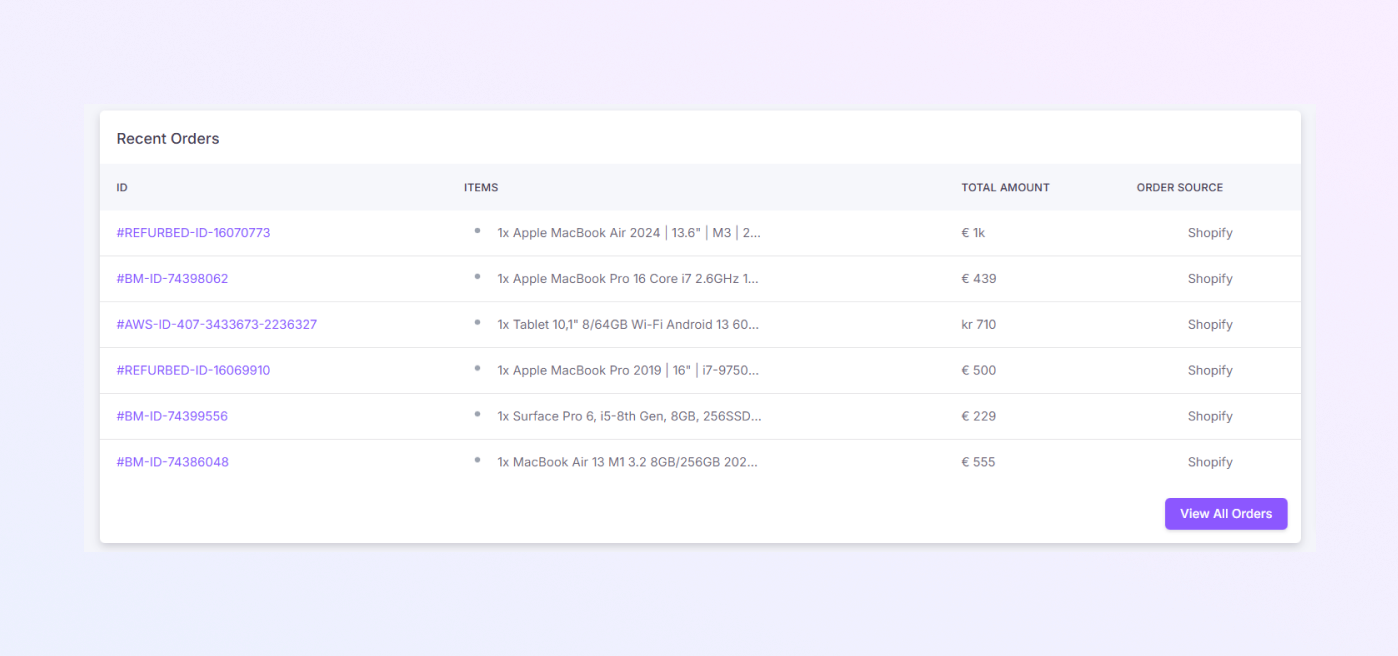
The most recent orders entered into the system are displayed in this section. Every row consists of:
-
Order ID
-
Product name
-
Total amount
-
Source of order (such as Shopify, Amazon)
-
Date and time
-
-
To view the complete order history, click "View All Orders". This allows you to stay informed about your most recent sales.
-
-
Country Revenue (Bottom-Right Section)
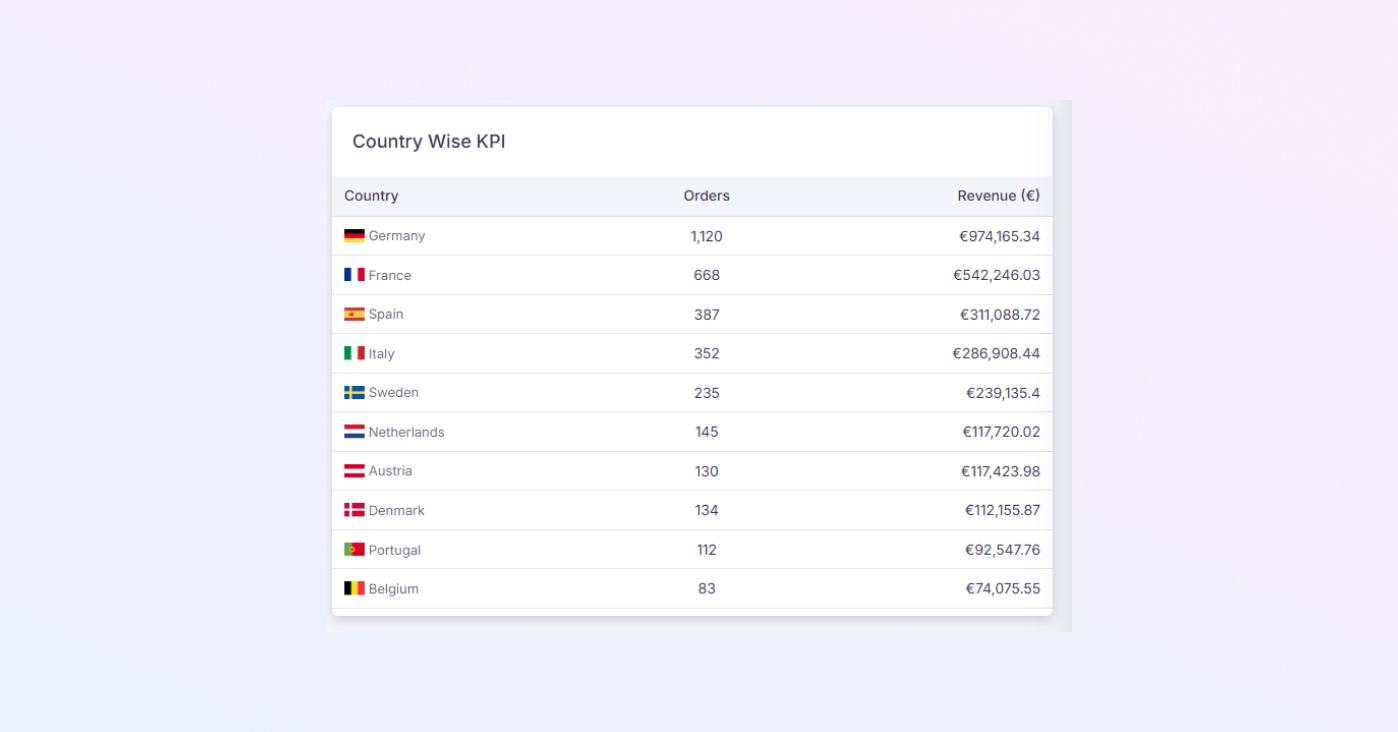
This section explains which countries make the most purchases, which places generate the highest revenue, and where you might want to grow.
Performance by country is displayed in the table, which includes:
-
Name of the country with flag
-
The no of orders coming from that Country
-
Total earnings
-
Average order value
-
On this page
1.
Top Header Bar
2.
Left Sidebar Menu
3.
Welcome Message
4.
Total Profit (Graph Section)
5.
Main Business Overview Cards (Top-Right)
6.
Transactions Section (Left-Middle)
7.
Total Revenue + Average Order Value (Middle Center)
8.
Type of Problems Analysis
9.
Marketplace Orders (Right-Middle Section)
10.
Recent Orders (Bottom-Middle Panel)
11.
Country Revenue (Bottom-Right Section)