

ExactFlow Dashboard Page User Guide
The Financial Agent Dashboard in the ExactFlow app helps you track your company’s financial performance in one place. It shows sales, revenue, expenses, profit, and cash flow in an easy-to-understand format.
This dashboard is mainly used by finance teams, accountants, and managers to monitor daily and monthly financial activity.
How to Open the Financial Agent Dashboard
Log in to your Exact Flow account.
From the left sidebar menu, click on Financial Agent.
Select Dashboard.
You will now see the Financial Agent Dashboard page.
Page Overview
The Financial Agent Dashboard is divided into multiple sections. Each section shows a different part of your financial data, such as revenue, profit, and cash flow.
At the top, you will see summary cards. Below that, you will find charts and graphs for deeper analysis.
Top Right Controls
Located at the top-right corner of the page.
Currency Selector
-
Allows you to select a currency from PLN, EUR, and USD.
-
The dashboard updates automatically based on the selected currency.
Date Range Selector
-
Allows you to select a start date and an end date.
-
The dashboard updates automatically based on the selected dates.
Use this to view daily, weekly, monthly, or custom financial periods and compare performance across different time ranges.

Key Financial Summary Cards
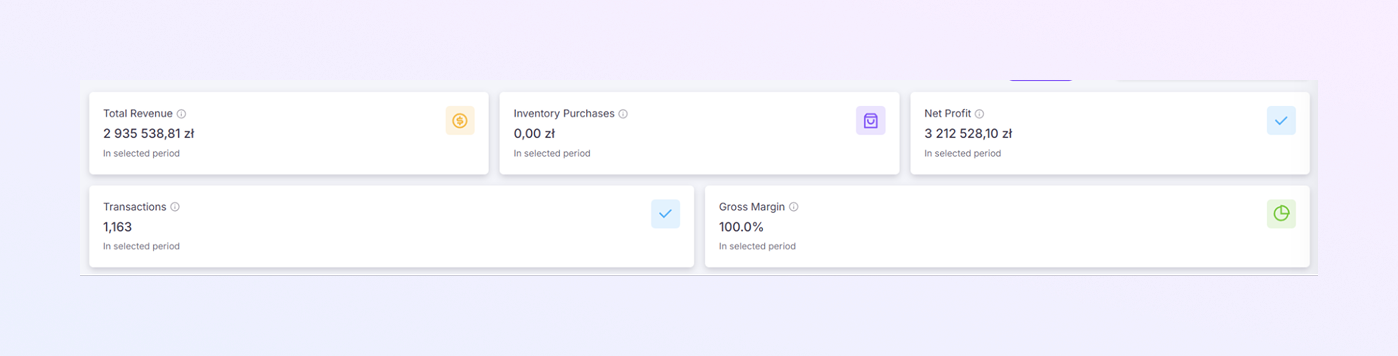
At the top of the dashboard, you will see several summary cards. These cards give you a quick snapshot of your financial health.
Total Revenue
Shows the total sales revenue generated during the selected period.
Includes all completed transactions.
Helps you understand how much money your business earned.
Inventory Purchases
Displays the total amount spent on inventory purchases.
Useful for tracking purchasing costs.
Helps monitor inventory-related expenses.
Net Profit
Shows the final profit after subtracting all expenses.
This is the actual earnings of the business.
A positive value means profit, and a low value indicates higher costs.
Transactions
Displays the total number of financial transactions.
Includes sales, purchases, and other recorded financial actions.
Helps track activity volume.
Gross Margin
Shows the gross margin percentage.
Indicates how much profit you keep after covering direct costs.
A higher gross margin means better efficiency.
Profit & Loss Overview (By Category)
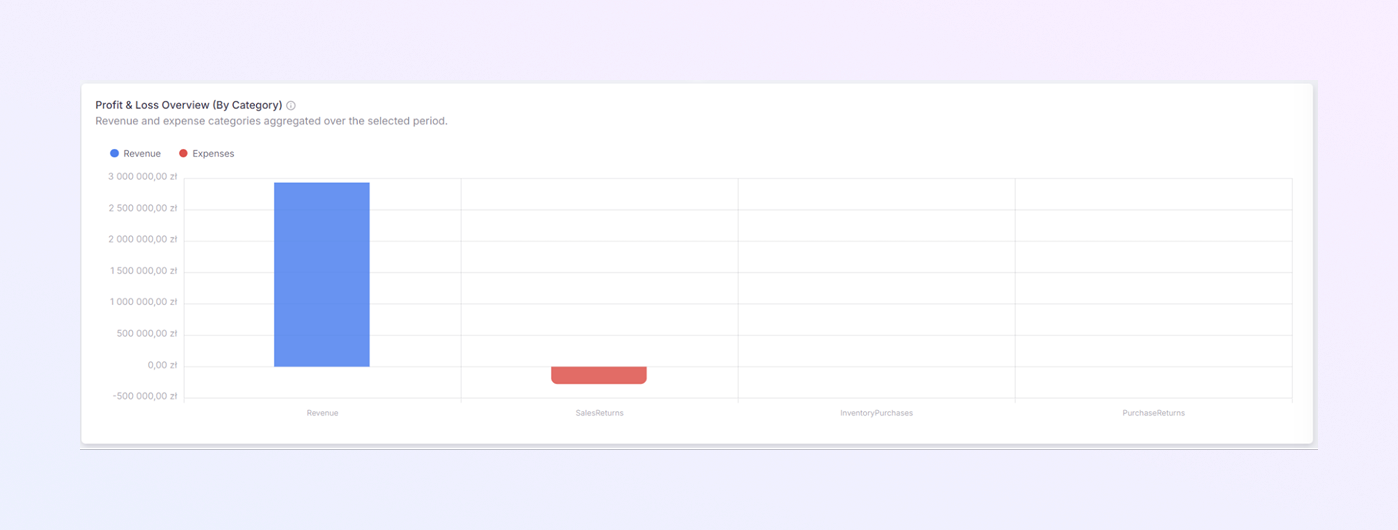
This section visually compares Revenue and Expenses.
-
A bar chart showing:
-
Revenue (usually in blue)
-
Expenses (usually in red)
-
-
Each bar represents total values for the selected period.
-
Helps you quickly see if revenue is higher than expenses.
-
Makes it easy to spot overspending.
-
Useful for quick financial checks.
Profit & Loss Overview (Monthly)
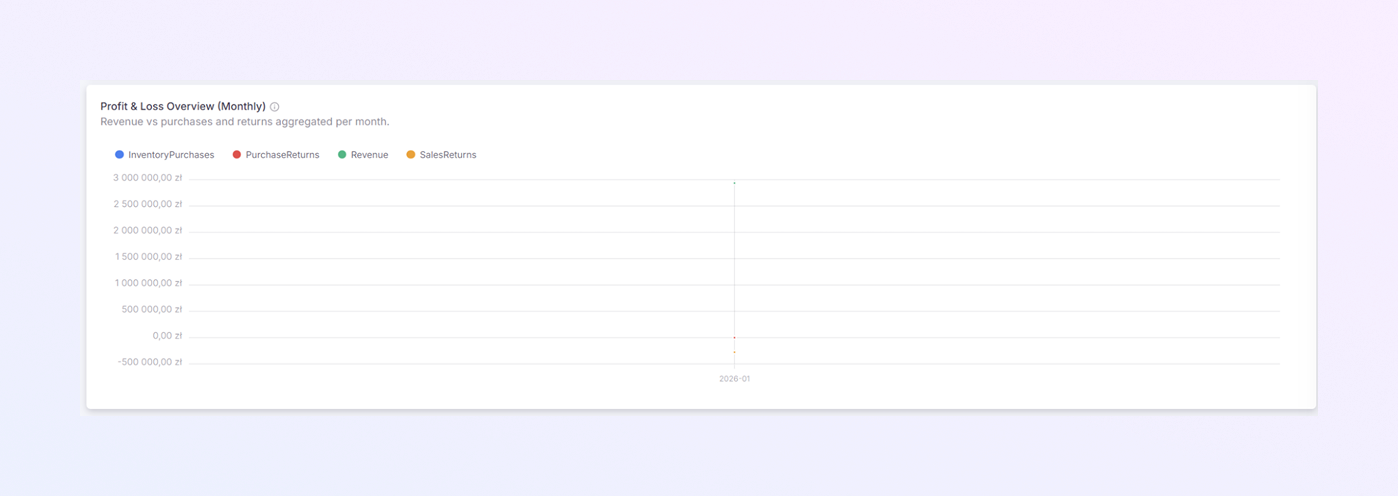
This section shows profit and loss trends over time.
-
Displays monthly values for:
-
Inventory Purchases
-
Product Returns
-
Revenue
-
Sales Returns
-
-
It helps to identify Growth trends, Seasonal changes, and Months with higher expenses. This is helpful for long-term financial planning.
Daily Cash Flow
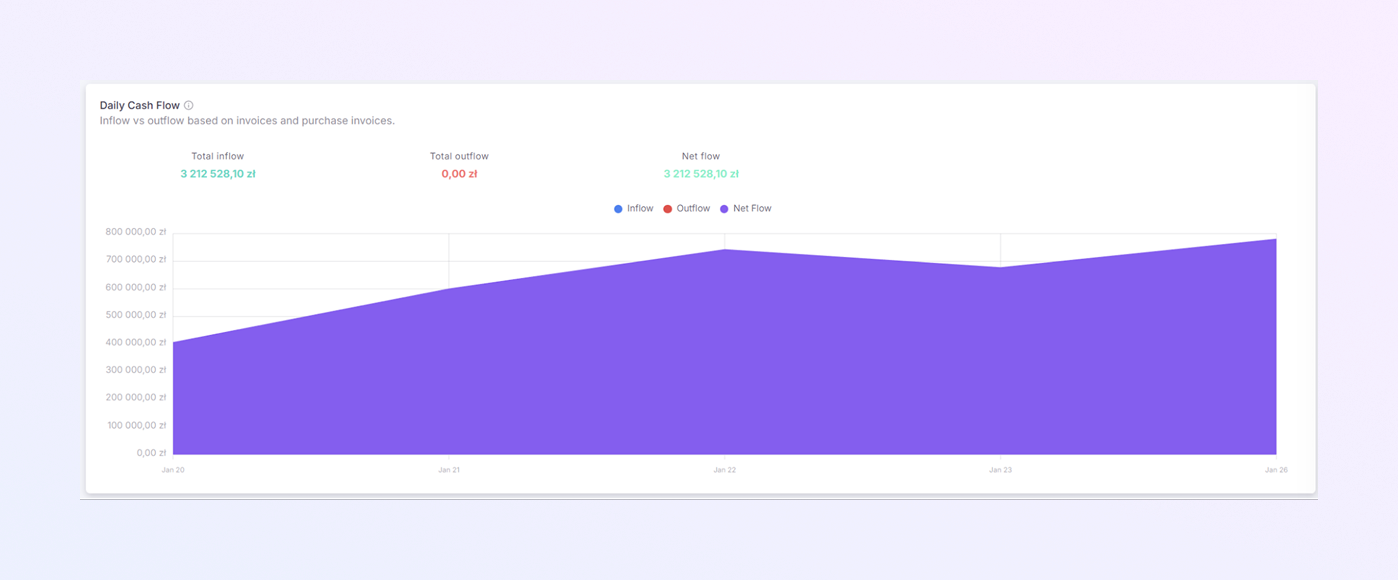
The Daily Cash Flow section shows how money moves in and out of your business.
-
Inflow: Money coming into the business
-
Outflow: Money going out of the business
-
Net Flow: Difference between inflow and outflow
Chart Type
-
Area or line chart showing daily movement
-
Easy to see peaks and drops in cash flow
-
It helps to ensure you always have enough cash
-
Identifies days with high expenses
-
Supports better cash management decisions
Cash Flow Summary
Above the cash flow chart, you will see three values:
-
Total Inflow: Total money received during the selected period
-
Total Outflow: Total money spent during the selected period
-
Net Flow: Final balance after inflow minus outflow
This gives a quick cash overview without checking the chart.
Cash Flow by Category
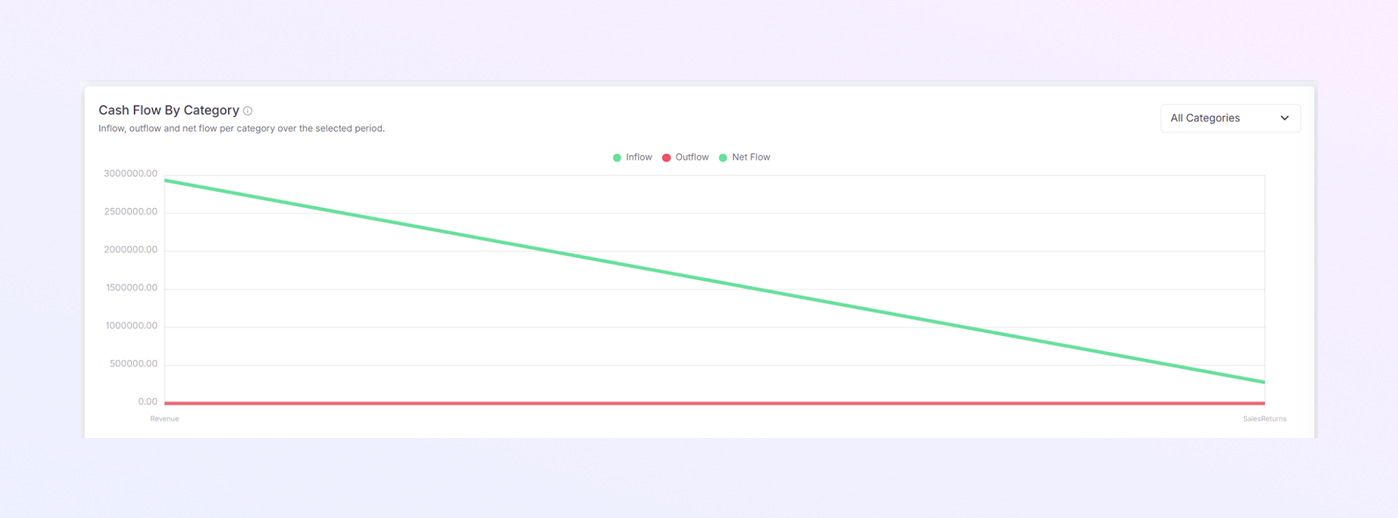
This section breaks down cash flow by category.
-
Line chart showing:
-
Inflow by category
-
Outflow by category
-
Net flow over time
-
-
Categories may include:
-
Revenue
-
Sales Returns
-
Category Filter
-
Located on the top-right of this section
-
Allows you to view all categories and focus on a specific category.
This helps you understand where your money is coming from and where it is going.
Summary
The Exact Flow Financial Agent Dashboard gives you:
-
A clear view of revenue, expenses, and profit
-
Easy cash flow tracking
-
Simple charts for quick understanding
-
Filters to analyze specific time periods
By using this dashboard daily, you can stay in control of your business finances and make confident financial decisions.