

ExactFlow Rewizor Page User Guide
The Rewizor page is part of the Financial Agent module in Exact Flow. It is used for financial review and analysis, especially for accounting, auditing, and monthly financial checks.
This page provides a clear overview of documents, sales, purchases, fees, payroll, and other key financial metrics in one place.
How to Open the Rewizor Page
Log in to your Exact Flow account.
From the left sidebar menu, click on Financial Agent.
Click on Rewizor.
You will now see the Rewizor (Financial Analysis Dashboard).
Page Overview
The Financial Agent Dashboard is divided into multiple sections. Each section shows a different part of your financial data, such as revenue, profit, and cash flow.
At the top, you will see summary cards. Below that, you will find charts and graphs for deeper analysis.
Top Right Controls
The Rewizor page is divided into three main parts:
-
Top controls (filters and view options)
-
Financial summary cards
-
Monthly activity chart
Each section helps you review financial data step by step.
Top Controls
View Type Selector
-
Located at the top-right corner.
-
The default value is Auto. You can choose day, week, and month.
-
Used to control how data is displayed.
Date Range Selector
-
Located next to the view selector.
-
Allows you to select a specific time period.
-
When you change the date range, all numbers and charts update automatically.
Navigation Tabs
Below the page title, you will see tabs for different financial views.
Available Tabs
Overview
Cashflow
Revenue
Expenses
Expense Categories
Payroll
Subscriptions
Shipping
Marketplace Fees
Vendors
Document Types
Registers
Overview
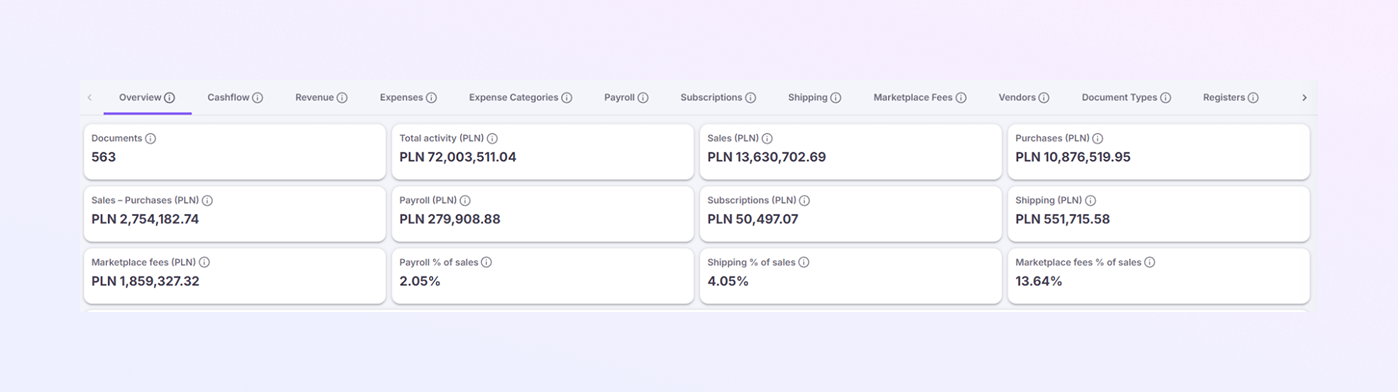
The Overview tab is selected by default and shows a summary of all key data.
Financial Summary Cards
These cards give you a quick snapshot of financial performance for the selected period.
Documents: Shows the total number of financial documents. Includes invoices, bills, and records. Useful for checking document volume.
Total Activity (PLN): Shows the total financial activity value. Includes sales and purchases combined.
Sales (PLN): Total value of all sales during the selected period. Helps track revenue performance.
Purchases (PLN): Total value of all purchases. Includes inventory and other buying costs.
Sales – Purchases (PLN): Shows the difference between sales and purchases. Helps understand gross financial balance.
Payroll (PLN): Total salary and payroll expenses. Helps track employee-related costs.
Subscriptions (PLN): Total cost of subscriptions. Includes software and service subscriptions.
Shipping (PLN): Total shipping expenses. Covers delivery and logistics costs.
Marketplace Fees (PLN): Total fees charged by marketplaces. Useful for profit analysis.
Payroll % of Sales: Shows how much payroll costs represent compared to sales. Displayed as a percentage.
Shipping % of Sales: Shows shipping costs as a percentage of sales. Helps measure logistics efficiency.
Marketplace Fees % of Sales: Shows marketplace fees compared to total sales. Useful for evaluating marketplace profitability.
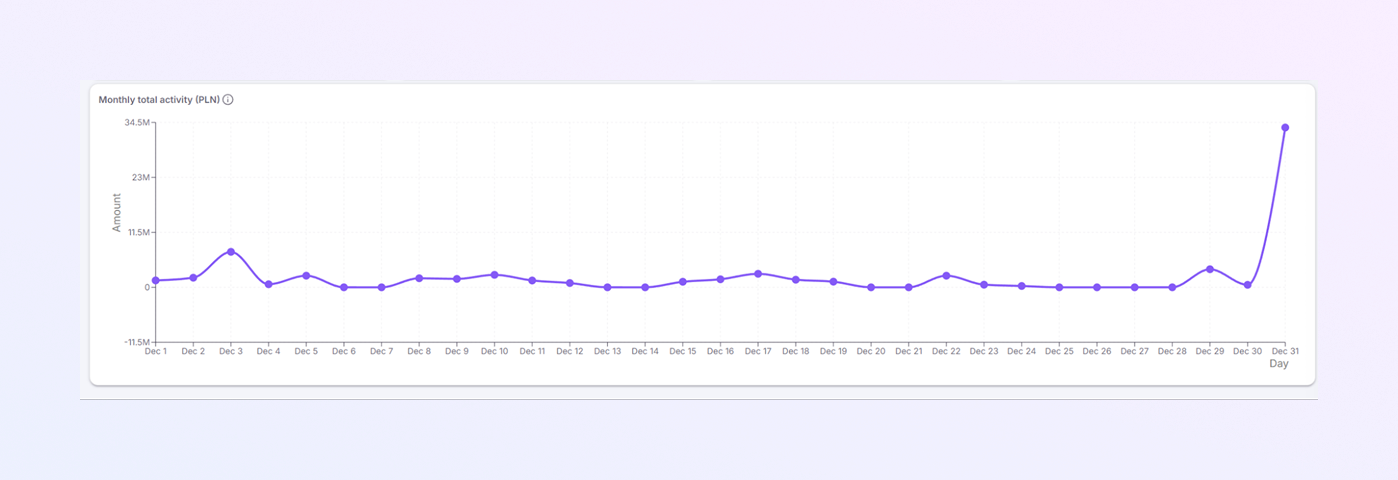
Monthly Total Activity Chart
Displays daily financial activity over the selected period.
X-axis: Days, Y-axis: Amount (PLN)
Spot high-activity days easily
Identify low or zero-activity days
Track trends across the month
Useful for audits and monthly closing
Each point represents total activity for that day.
How to Use the Chart
Cashflow
The Cashflow tab shows how money moves in and out of the business during the selected period. It helps you understand liquidity, daily cash movement, and overall cash balance.
Cashflow Summary Cards
These cards give a quick overview of cash activity for the selected date range.
Total Inflow (PLN): Shows the total amount of money received. Includes payments from sales, refunds received, and other incoming funds.
Total Outflow (PLN): Shows the total amount of money paid out. Includes purchases, payroll, shipping costs, fees, and other expenses.
Inflow – Outflow (PLN): Shows the net cash result. Calculated as inflow minus outflow. A positive value means more money came in than went out.

Cash Movement Over Time
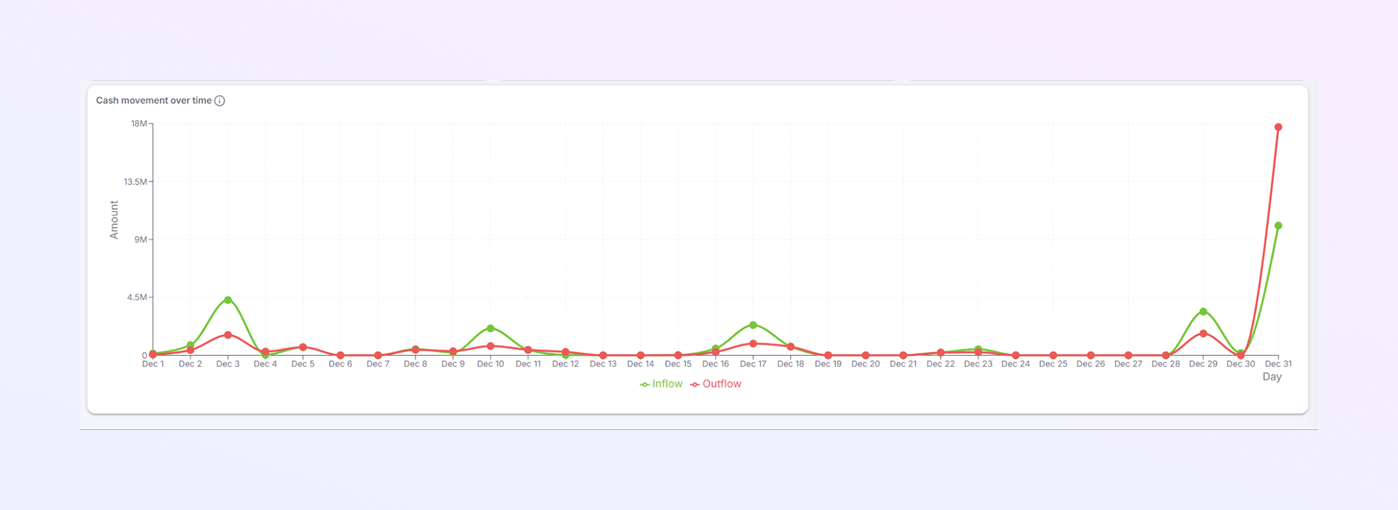
This section shows how cash inflow and outflow change day by day.
Line chart displaying daily cash activity.
-
Two lines are shown:
Inflow (green): Money coming into the business
Outflow (red): Money going out of the business
X-axis: Days (for example: Dec 1 to Dec 31)
Y-axis: Amount in PLN
Each point on the chart represents the total inflow or outflow for that day.
How to Use the Cashflow Chart
Spot days with high cash inflow
-
Identify days with high expenses
See patterns across the month
Detect unusual spikes or drops
Check if cash flow stays positive over time
This is especially useful for cash planning and financial control.
Revenue
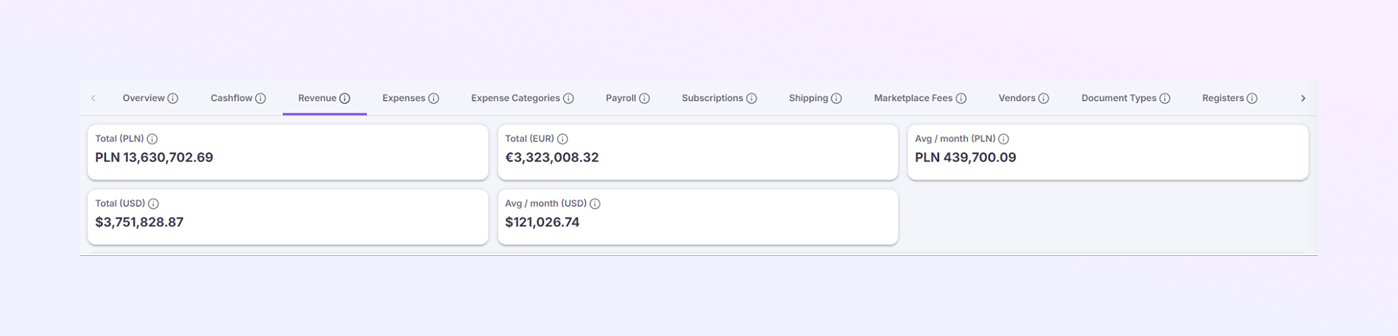
The Revenue tab shows how much money the business earned during the selected period. It displays total revenue in different currencies and shows how revenue changes over time.
Revenue Summary Cards
These cards give a quick view of total and average revenue.
-
Total (PLN): Shows the total revenue in PLN. This is the main accounting value.
-
Total (EUR): Shows total revenue converted to EUR. Useful for international reporting.
-
Total (USD): Shows total revenue converted to USD. Helpful for global financial analysis.
-
Avg / Month (PLN): Shows the average monthly revenue in PLN. Calculated based on the selected date range.
-
Avg / Month (USD): Shows the average monthly revenue in USD. Helps compare performance across months.
Revenue Over Time
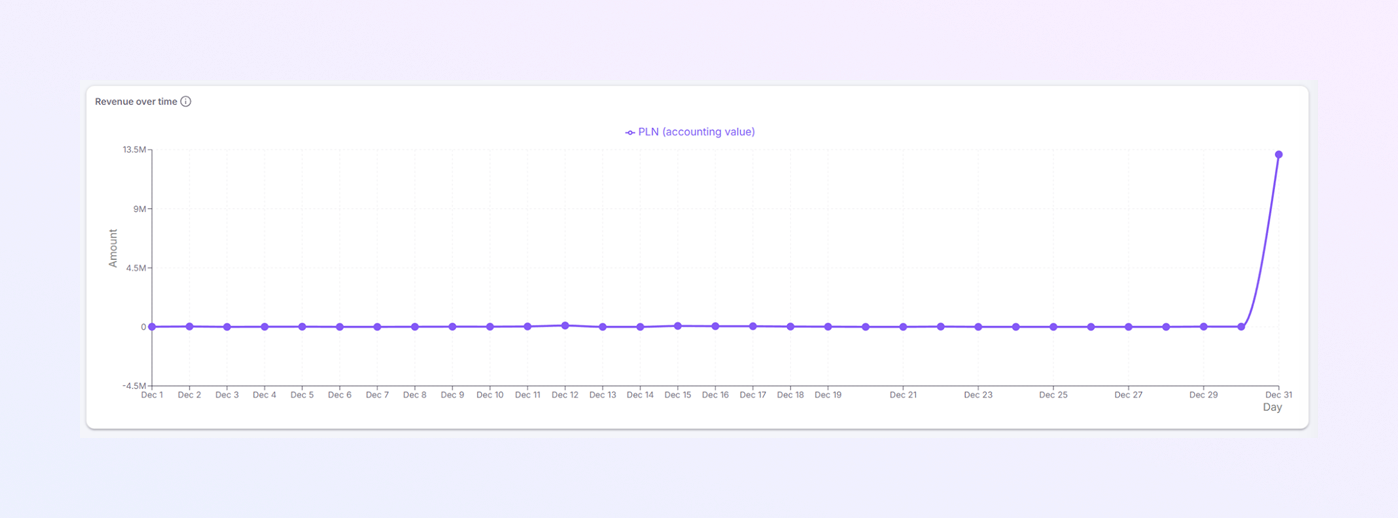
This section shows how revenue changes day by day during the selected period.
-
Line chart displaying daily revenue.
-
Shows PLN accounting values.
-
Helps visualize revenue trends clearly.
-
X-axis: Days (for example: Dec 1 to Dec 31)
-
Y-axis: Amount in PLN
-
Each point represents the revenue recorded on that day.
How to Use the Revenue Chart
-
Track daily sales performance
-
Identify high-revenue days
-
Spot slow sales periods
-
Compare early and late month performance
Expenses
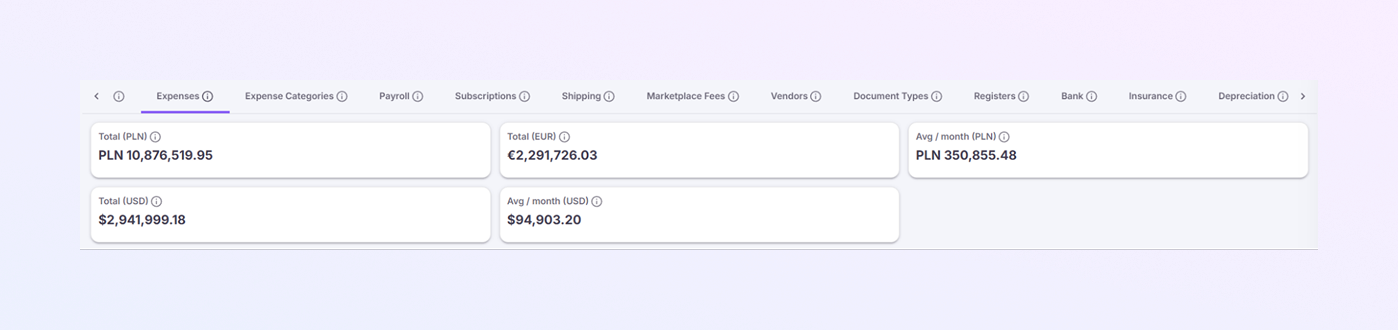
The Expenses tab shows how much money the business spent during the selected period. It helps you understand costs, control spending, and review financial efficiency.
Expenses Summary Cards
These cards give a quick overview of total and average expenses.
-
Total (PLN): Shows the total expenses in PLN. This is the main accounting value.
-
Total (EUR): Shows total expenses converted to EUR. Useful for international financial reporting.
-
Total (USD): Shows total expenses converted to USD. Helpful for global cost comparison.
-
Avg / Month (PLN): Shows the average monthly expenses in PLN. Calculated from the selected date range.
-
Avg / Month (USD): Shows the average monthly expenses in USD. Helps compare spending levels month by month.
Expenses Over Time
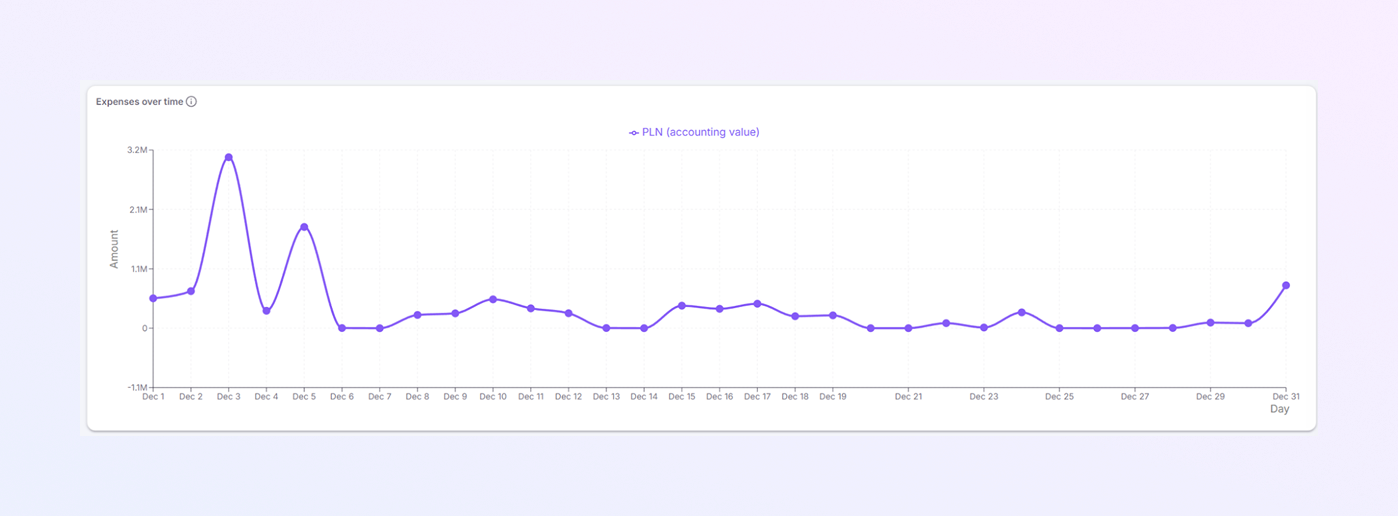
This section shows how expenses change day by day during the selected period.
-
Line chart displaying daily expenses.
-
Values are shown in PLN accounting value.
-
Makes it easy to follow spending patterns.
-
X-axis: Days (for example: Dec 1 to Dec 31)
-
Y-axis: Amount in PLN
-
Each point represents the total expenses recorded on that day.
How to Use the Expenses Chart
-
Identify days with high spending
-
Spot unusual expense spikes
-
Compare expenses across the month
-
Support cost control and budgeting
-
Prepare data for financial reviews
Expense Categories
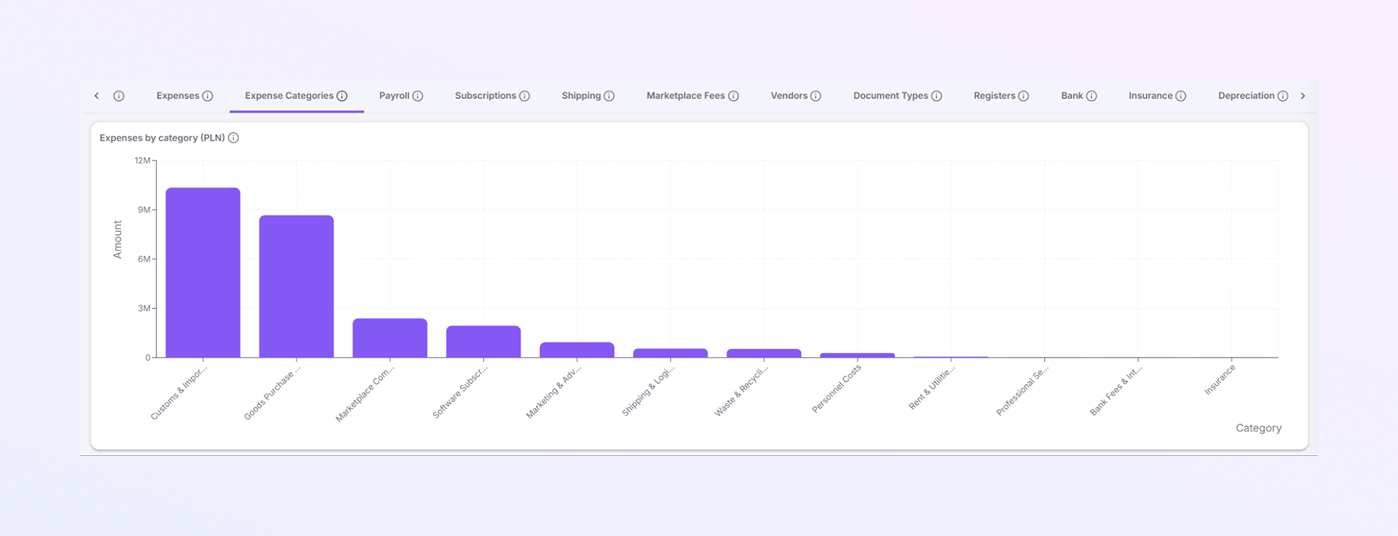
The Expense Categories tab shows how total expenses are split by category. It helps you understand where money is being spent and which cost areas are the highest.
Expenses by Category (PLN)
This section displays expenses grouped into clear categories.
Expense Categories Chart
-
Bar chart showing total expenses per category.
-
Values are displayed in PLN.
-
Each bar represents one expense category.
-
X-axis: Expense categories
-
Y-axis: Amount in PLN
-
This chart helps you quickly compare costs across categories.
Expense Categories Table
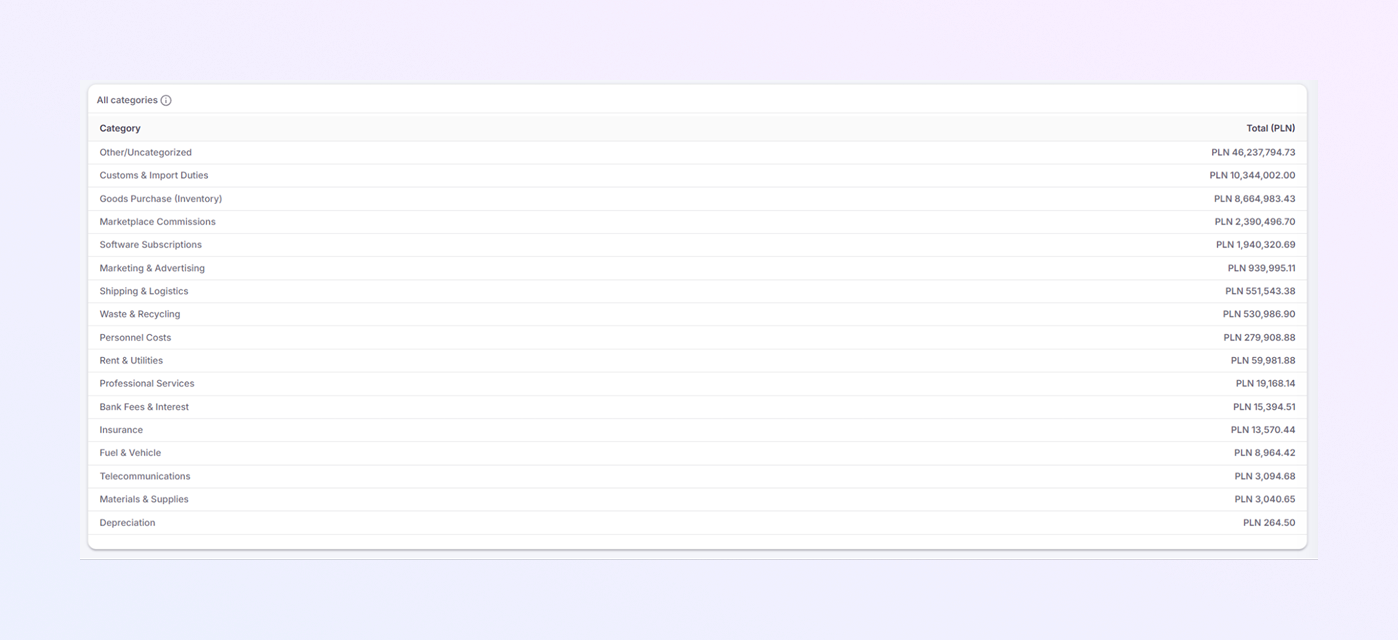
Below the chart, a table shows exact amounts for each category.
-
Other / Uncategorized: Expenses that do not fit into a specific category.
-
Customs & Import Duties: Taxes and fees paid for importing goods.
-
Goods Purchase (Inventory): Cost of buying products for resale.
-
Marketplace Commissions: Fees charged by online marketplaces.
-
Software Subscriptions: Costs for software tools and platforms.
-
Marketing & Advertising: Expenses for ads, promotions, and campaigns.
-
Shipping & Logistics: Delivery, transport, and logistics costs.
-
Waste & Recycling: Costs related to waste handling and recycling.
-
Personnel Costs: Salaries, wages, and employee-related expenses.
-
Rent & Utilities: Office rent and utility bills.
-
Professional Services: Fees for legal, accounting, or consulting services.
-
Bank Fees & Interest: Charges from banks and financial institutions.
-
Insurance: Insurance premiums paid by the company.
-
Fuel & Vehicle: Fuel, vehicle maintenance, and transport-related costs.
-
Telecommunications: Phone, internet, and communication services.
-
Materials & Supplies: Office supplies and operational materials.
-
Depreciation: Value reduction of assets over time. Used for accounting purposes.
Payroll
The Payroll tab shows all employee-related costs for the selected period. It helps you track salaries and payroll expenses over time.
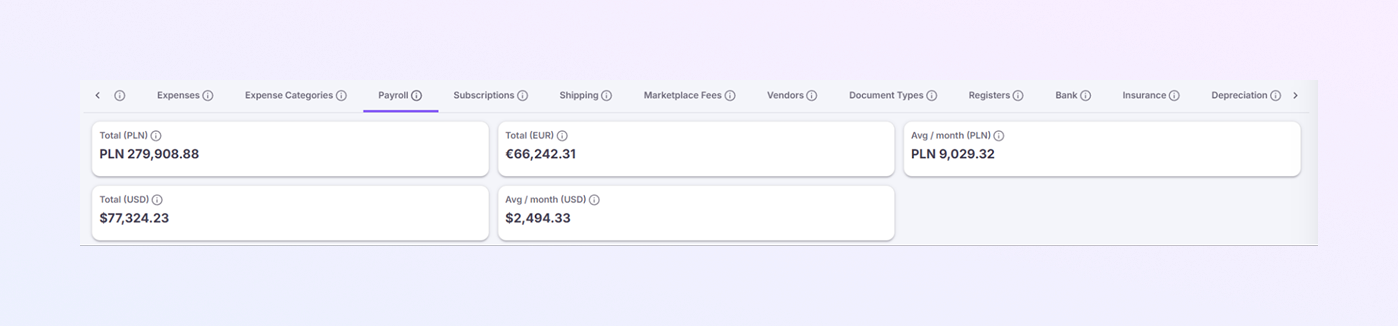
Payroll Summary Cards
These cards give a quick overview of total and average payroll costs.
-
Total (PLN): Shows the total payroll cost in PLN. This is the main accounting value.
-
Total (EUR): Shows total payroll cost converted to EUR. Useful for international reporting.
-
Total (USD): Shows total payroll cost converted to USD. Helpful for global financial comparison.
-
Avg / Month (PLN): Shows the average monthly payroll cost in PLN. Calculated based on the selected date range.
-
Avg / Month (USD): Shows the average monthly payroll cost in USD. Helps compare payroll levels across months.
Payroll Over Time
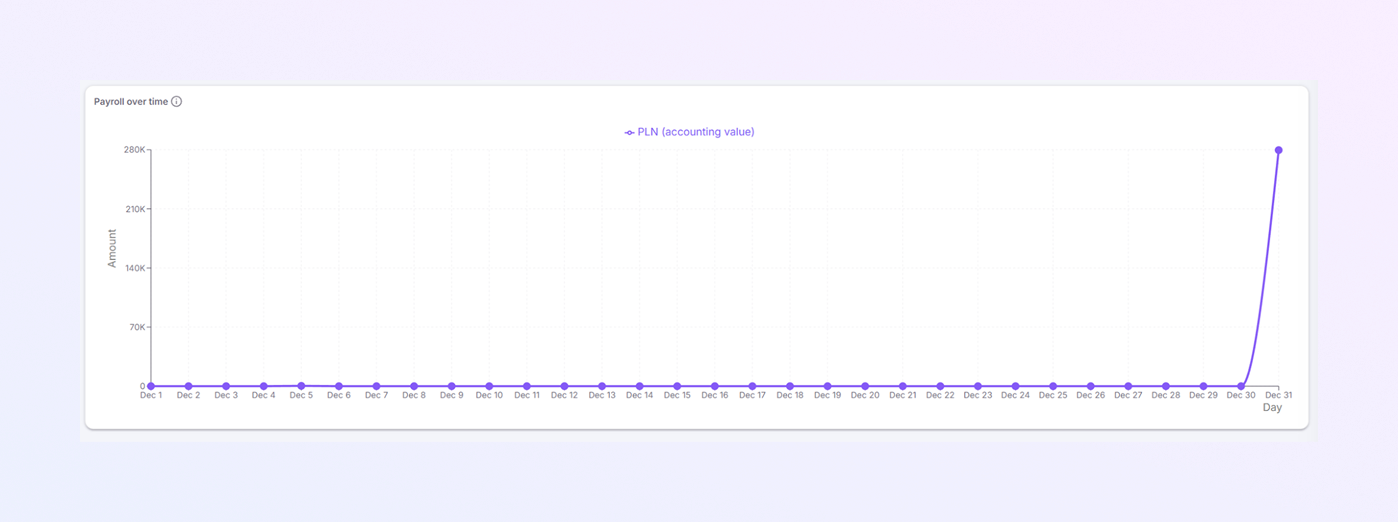
This section shows how payroll costs change day by day during the selected period.
-
Line chart displaying daily payroll expenses.
-
Values are shown in PLN accounting value.
-
Makes it easy to track payroll distribution over time.
-
X-axis: Days (for example: Dec 1 to Dec 31)
-
Y-axis: Amount in PLN
-
Each point represents payroll expenses recorded on that day.
How to Use the Payroll Chart
-
Identify when payroll costs are recorded
-
Check the consistency of salary payments
-
Spot unusual payroll spikes
-
Support payroll audits and reviews
-
Verify monthly payroll totals
Subscriptions
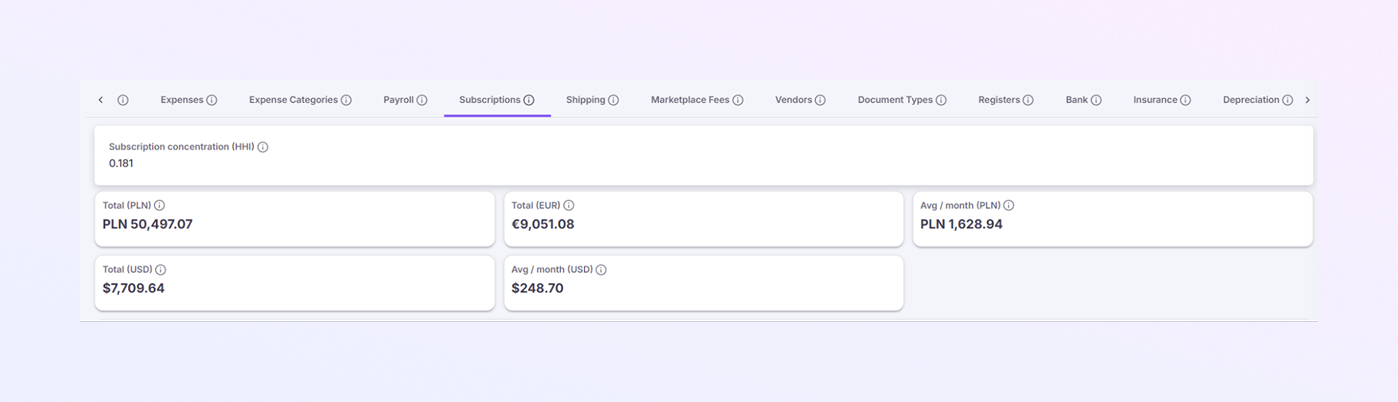
The Subscriptions tab shows all subscription-related costs, such as software tools and recurring services. It helps you track how much you spend on subscriptions and how evenly those costs are distributed.
Subscription Summary Cards
These cards give a quick overview of subscription expenses.
-
Subscription Concentration (HHI): Shows how subscription costs are spread across providers. A lower value means costs are more evenly distributed. A higher value means spending is focused on fewer subscriptions.
-
Total (PLN): Shows the total subscription cost in PLN. This is the main accounting value.
-
Total (EUR): Shows total subscription cost converted to EUR. Useful for international reporting.
-
Total (USD): Shows total subscription cost converted to USD. Helpful for global cost comparison.
-
Avg / Month (PLN): Shows the average monthly subscription cost in PLN. Calculated based on the selected date range.
-
Avg / Month (USD): Shows the average monthly subscription cost in USD. Helps compare recurring costs month by month.
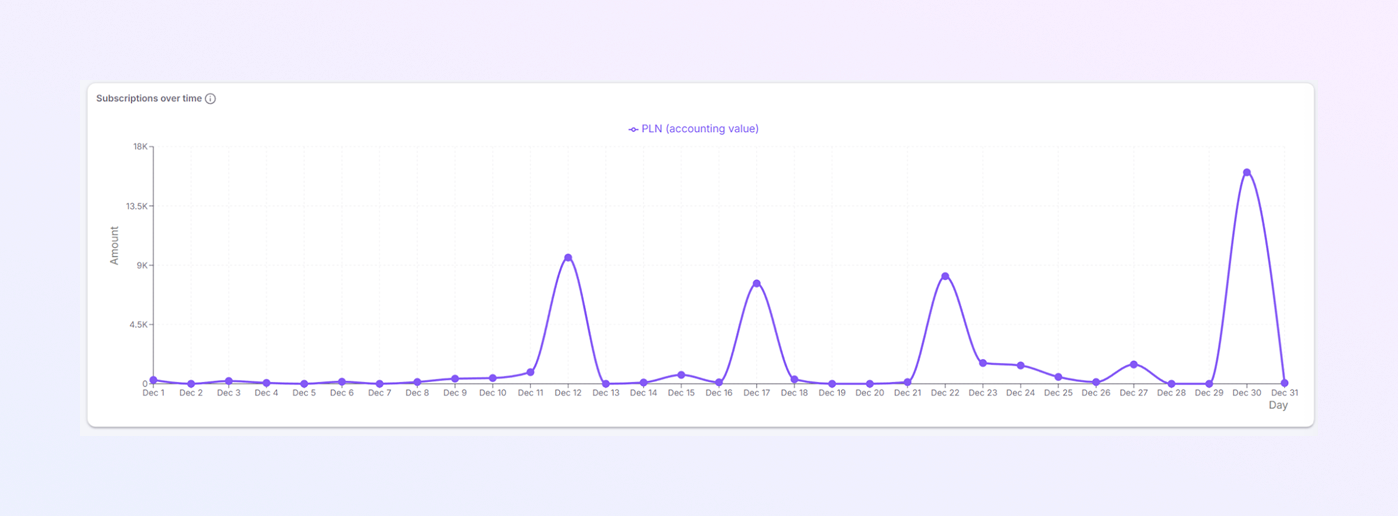
Subscriptions Over Time
This section shows how subscription expenses change day by day.
-
Line chart displaying daily subscription costs.
-
Values are shown in PLN accounting value.
-
Makes it easy to track recurring payments.
-
X-axis: Days (for example: Dec 1 to Dec 31)
-
Y-axis: Amount in PLN
Each point represents subscription expenses recorded on that day.
How to Use the Subscriptions Chart
-
See when subscription payments are charged
-
Identify recurring billing patterns
-
Spot unexpected subscription increases
-
Support cost reviews and optimization
Shipping
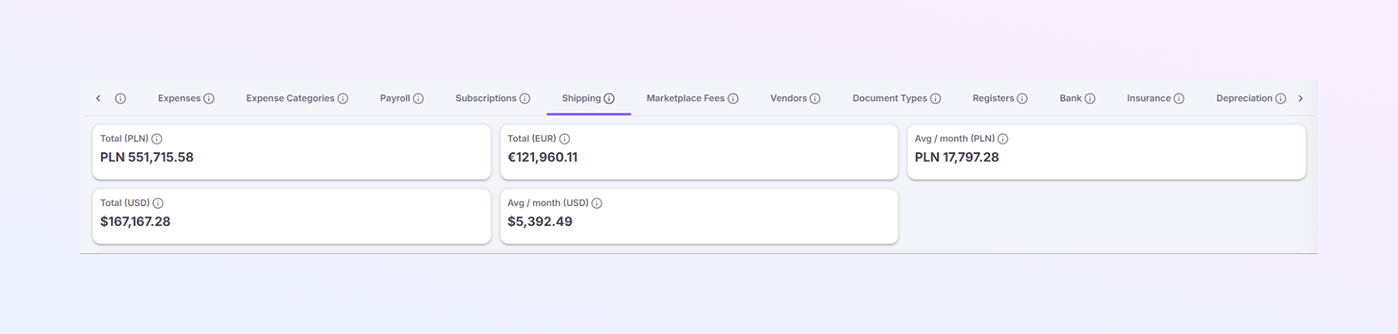
The Shipping tab shows all delivery and logistics costs for the selected period. It helps you track shipping expenses, spot cost changes, and monitor month-to-month variations.
Shipping Summary Cards
These cards give a quick overview of total and average shipping costs.
-
Total (PLN): Shows the total shipping cost in PLN. This is the main accounting value.
-
Total (EUR): Shows total shipping cost converted to EUR. Useful for international reporting.
-
Total (USD): Shows total shipping cost converted to USD. Helpful for global cost comparison.
-
Avg / Month (PLN): Shows the average monthly shipping cost in PLN. Calculated based on the selected date range.
-
Avg / Month (USD): Shows the average monthly shipping cost in USD. Helps compare shipping costs month by month.
Shipping Costs Over Time
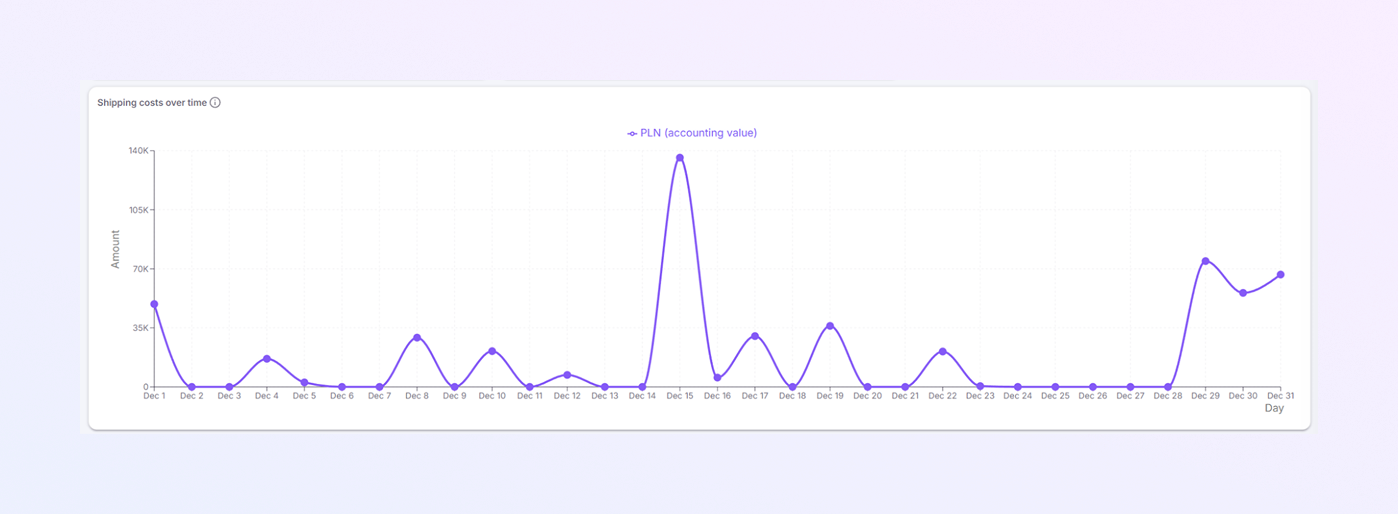
This section shows how shipping expenses change day by day.
-
Line chart displaying daily shipping costs.
-
Values are shown in PLN accounting value.
-
Makes it easy to see cost patterns and spikes.
-
X-axis: Days (for example: Dec 1 to Dec 31)
-
Y-axis: Amount in PLN
-
Each point represents shipping costs recorded on that day.
How to Use the Shipping Chart
-
Identify days with high shipping costs
-
Spot unusual cost spikess
-
Track shipping trends across the month
-
Support logistics and cost control decisions
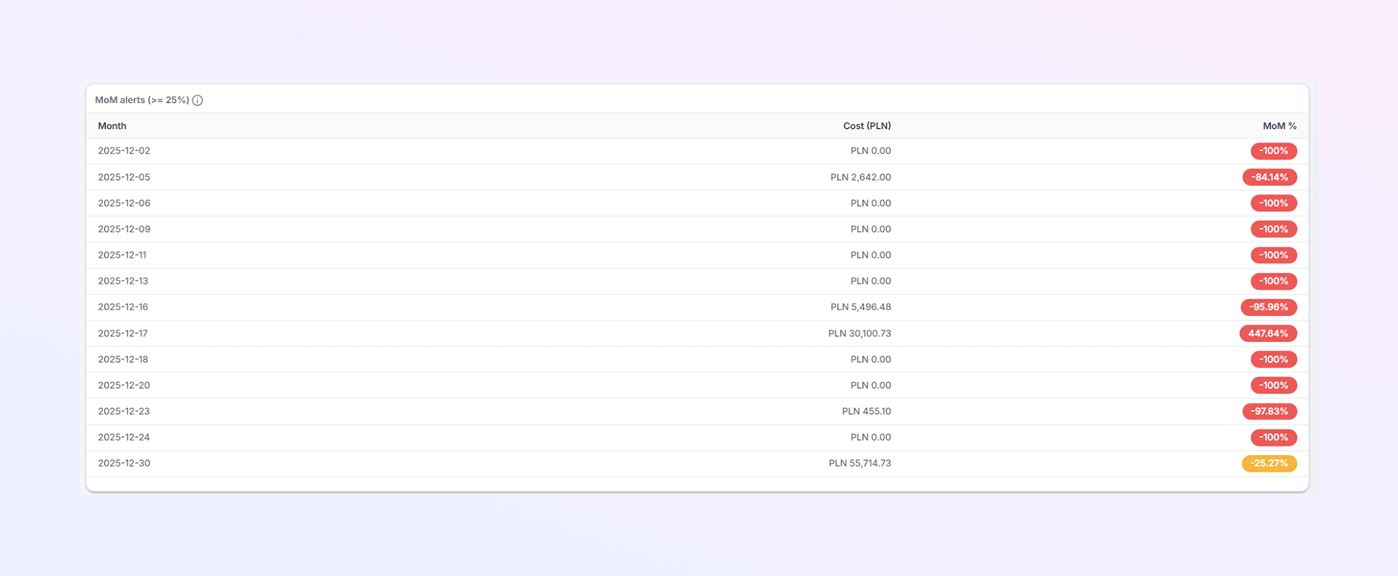
MoM Alerts (Month-over-Month Changes ≥ 25%)
This section highlights significant changes in shipping costs compared to the previous period.
MoM Alerts Table
Each row shows:
-
Month: Date of the shipping cost record
-
Cost (PLN): Shipping cost for that date
-
MoM %: Percentage increase or decrease compared to the previous period
How to Read MoM Alerts
-
Positive %: Shipping costs increased
-
Negative %: Shipping costs decreased
-
-100%: No shipping cost recorded for that day
-
Large positive values indicate sudden cost spikes
-
Large negative values indicate sharp drops
This table helps you quickly find unusual changes in shipping expenses.
Marketplace Fees
The Marketplace Fees tab shows all fees charged by online marketplaces for the selected period. It helps you understand how much marketplaces cost and how these fees change over time.
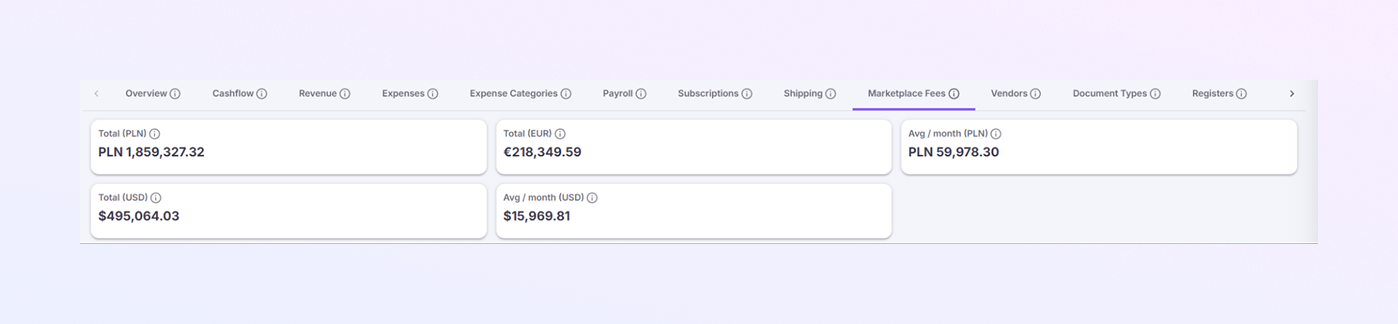
Marketplace Fees Summary Cards
These cards give a quick overview of total and average marketplace fees.
-
Total (PLN): Shows the total marketplace fees in PLN. This is the main accounting value.
-
Total (EUR): Shows total marketplace fees converted to EUR. Useful for international reporting.
-
Total (USD): Shows total marketplace fees converted to USD. Helpful for global financial comparison.
-
Avg / Month (PLN): Shows the average monthly marketplace fees in PLN. Calculated from the selected date range.
-
Avg / Month (USD): Shows the average monthly marketplace fees in USD. Helps compare fee levels month by month.
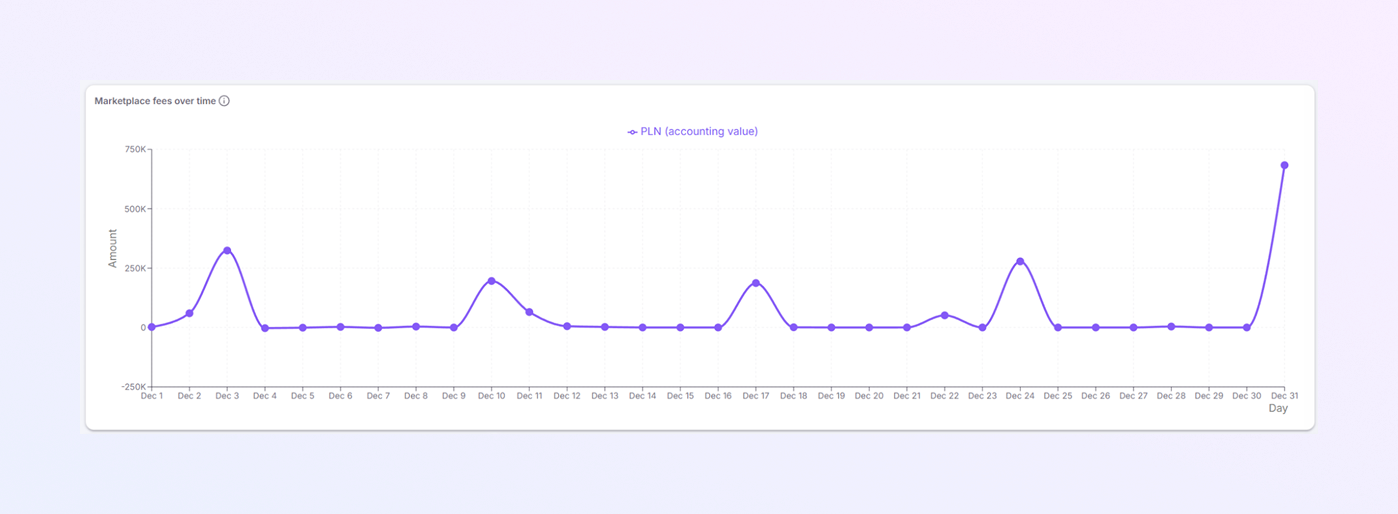
Marketplace Fees Over Time
This section shows how marketplace fees change day by day.
-
Line chart displaying daily marketplace fees.
-
Values are shown in PLN accounting value.
-
Makes it easy to see fee patterns and spikes.
-
X-axis: Days (for example: Dec 1 to Dec 31)
-
Y-axis: Amount in PLN
-
Each point represents marketplace fees recorded on that day.
Average Fees as % of Sales
-
Shows the average percentage of sales taken by marketplaces.
-
Helps understand how fees impact revenue.
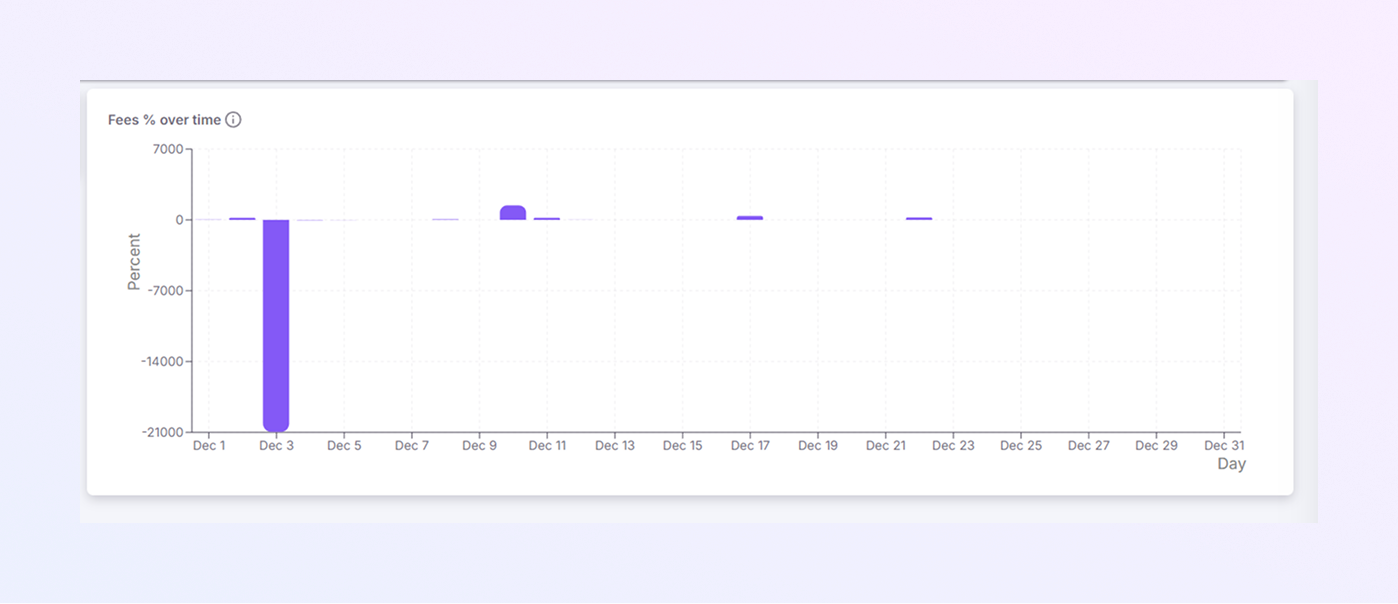
Fees % Over Time
This section shows how marketplace fees behave as a percentage of sales.
-
Line chart displaying daily fee percentages.
-
Shows how fees rise or fall compared to sales volume.
-
Useful for monitoring marketplace efficiency.
How to Use the Fees % Chart
-
Identify days with unusually high fees
-
Compare fees against sales performance
-
Detect changes in marketplace fee policies
-
Support pricing and marketplace strategy decisions

Vendors
The Vendors tab shows all companies and suppliers your business pays. It helps you understand where your money goes, which vendors cost the most, and how spending is distributed.
Search Vendors
-
The search bar is located at the top of the page.
-
Type a vendor name to quickly find it.
-
Useful when you have many vendors in the list.
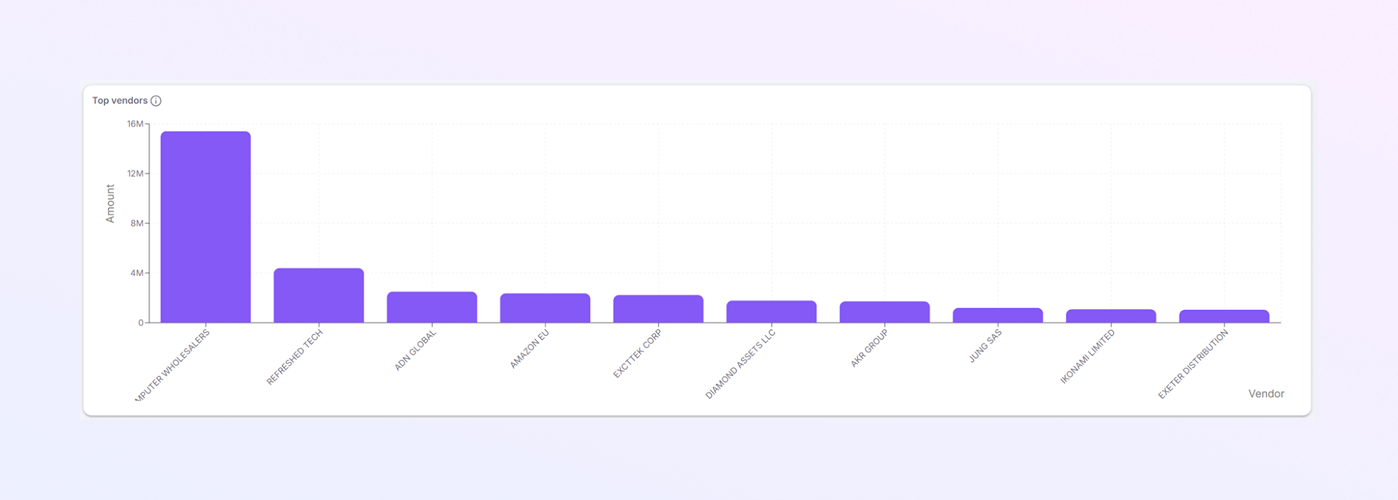
Top Vendors
This section highlights vendors with the highest total spending.
-
Bar chart showing spending by vendor.
-
Values are displayed in PLN.
-
Each bar represents one vendor.
This makes it easy to see which vendors have the biggest financial impact.
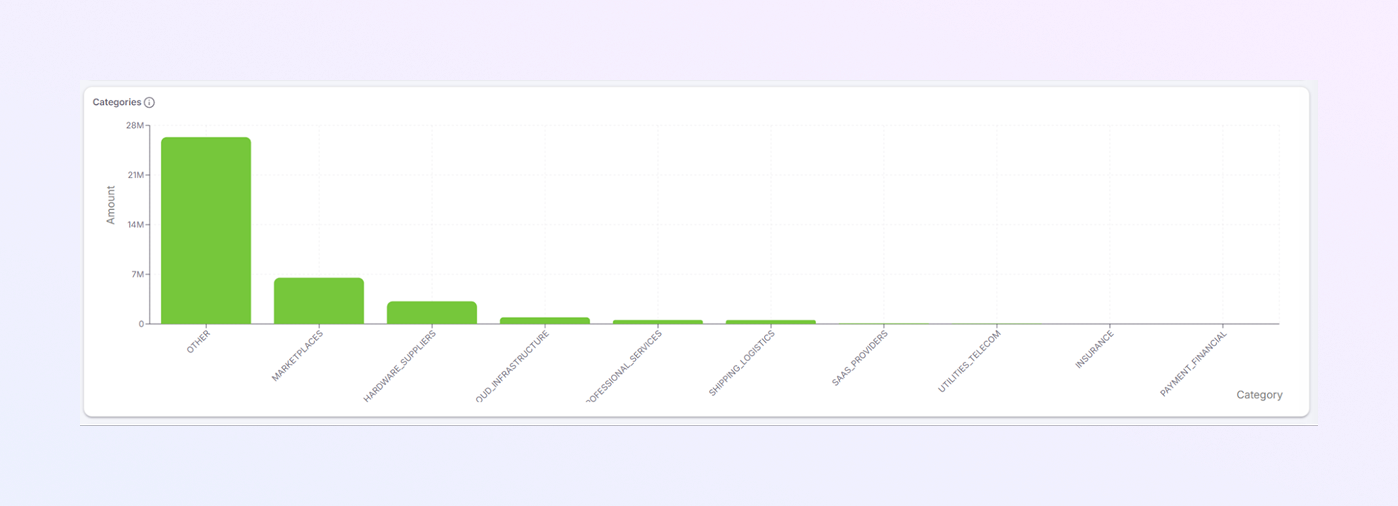
Vendor Categories
This section shows how vendor spending is split by category.
-
Bar chart showing total spend per vendor category.
-
Categories include:
OTHER
MARKETPLACES
HARDWARE_SUPPLIERS
CLOUD_INFRASTRUCTURE
PROFESSIONAL_SERVICES
SHIPPING_LOGISTICS
SAAS_PROVIDERS
UTILITIES_TELECOM
INSURANCE
PAYMENT_FINANCIAL
This helps you understand which types of vendors cost the most.
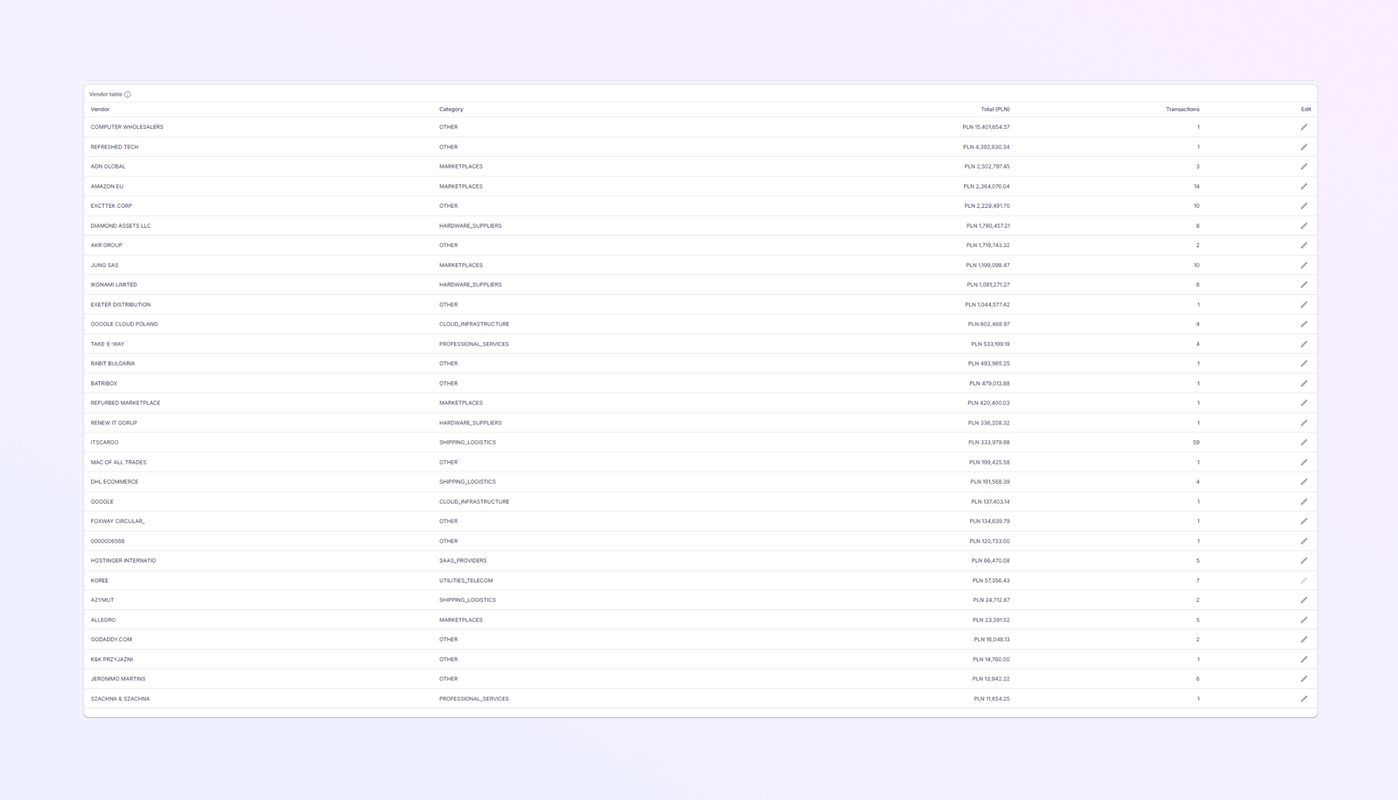
Vendor Table
The vendor table shows detailed information for each vendor.
-
Vendor: Name of the vendor or supplier.
-
Category: Vendor classification based on service or product type. Helps group similar vendors together.
-
Total (PLN): Total amount paid to the vendor. Shown in PLN accounting value.
-
Transactions: Number of transactions recorded for the vendor. Helps understand payment frequency.
-
Edit: Allows you to update vendor details. Useful for correcting names or categories.
How to Use the Vendors Tab
-
Identify top-spending vendors
-
Control supplier costs
-
Review vendor categories for budgeting
-
Support supplier negotiations
-
Prepare data for audits and reports
Recurring Vendors
-
Shows vendors with regular, recurring payments.
-
Example: monthly services or subscriptions.
If no data is shown, it means recurring vendors are not yet configured or detected.

Document Types
The Document Types tab shows all financial document types used in the system. It helps you understand how many documents exist, what kind they are, and their total financial value.
Search Document Types
-
The Document Type Search Bar is located at the top of the page.
-
Type a document name to quickly find it.
-
Useful when working with many document types.

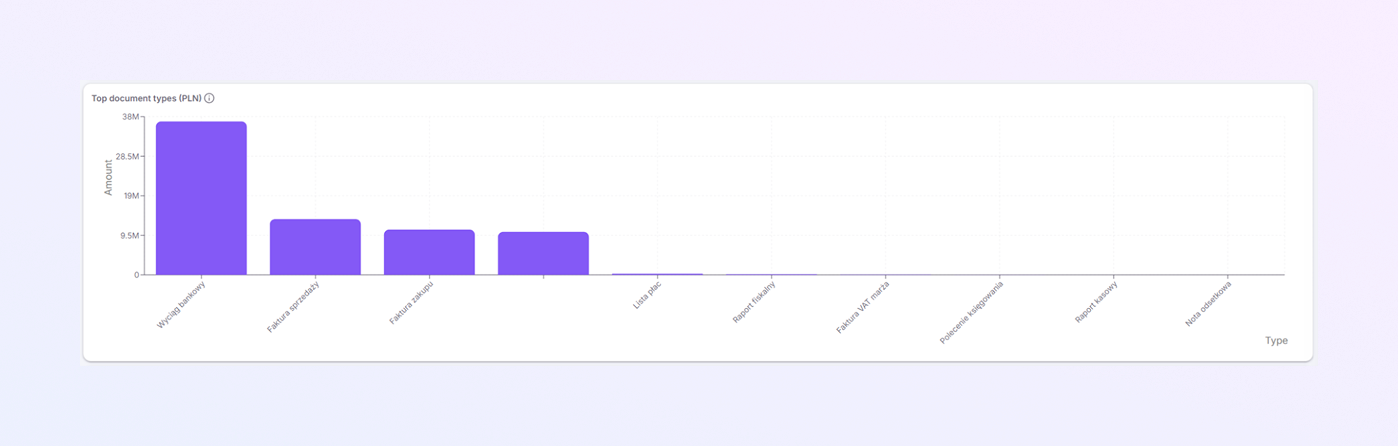
Top Document Types (PLN)
This section highlights document types with the highest total value.
-
Bar chart showing total value by document type.
-
Values are displayed in PLN.
-
Each bar represents one document type.
This helps you quickly see which document types impact finances the most.
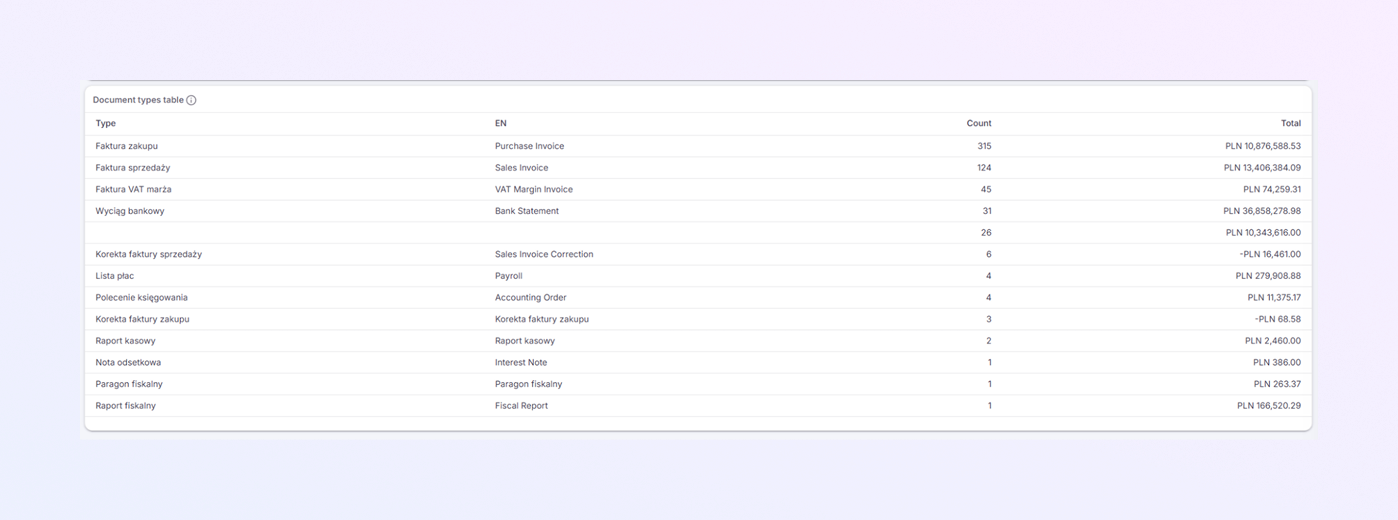
Document Types Table
The table below shows detailed information for each document type.
-
Type: Document name in the original language.
-
EN: English name of the document type. Helps non-local users understand the document's purpose.
-
Count: Number of documents of this type. Shows how frequently the document is used.
-
Total: Total financial value of all documents of this type. Displayed in PLN. Negative values indicate corrections or refunds.
Common Document Types
-
Faktura zakupu (Purchase Invoice): Supplier purchase invoices. Used to record expenses and purchases.
-
Faktura sprzedaży (Sales Invoice): Customer sales invoices. Used to record revenue.
-
Faktura VAT marża (VAT Margin Invoice): Used for margin-based VAT accounting. Common in refurbished or resale businesses.
-
Wyciąg bankowy (Bank Statement): Bank transaction records. Often have high total values due to transaction volume.
-
Korekta faktury sprzedaży (Sales Invoice Correction): Corrections to issued sales invoices.n Usually shown as negative values.
-
Korekta faktury zakupu (Purchase Invoice Correction): Corrections to purchase invoices. Adjusts previously recorded costs.
-
Lista płac (Payroll): Payroll and salary documents. Used for employee payments.
-
Polecenie księgowania (Accounting Order): Internal accounting adjustments. Used for manual entries.
-
Raport kasowy (Cash Report): Cash register or cash movement reports.
-
Raport fiskalny (Fiscal Report): Fiscal device reports. Used for tax and compliance purposes.
-
Nota odsetkowa (Interest Note): Interest charges or penalties.
-
Paragon fiskalny (Fiscal Receipt): Sales receipt from fiscal devices.
How to Use the Document Types Tab
-
Review document volume by type
-
Spot missing or unusual documents
-
Support accounting checks
-
Prepare data for audits
-
Understand financial structure
Registers
The Registers tab shows how financial documents are grouped into accounting registers. Registers are used for accounting, tax reporting, and compliance purposes. This tab helps you see document volume and value per register.
Search Registers
-
The Register Search Bar is located at the top of the page.
-
Type a register code to find it quickly.
-
Useful when working with many registers.

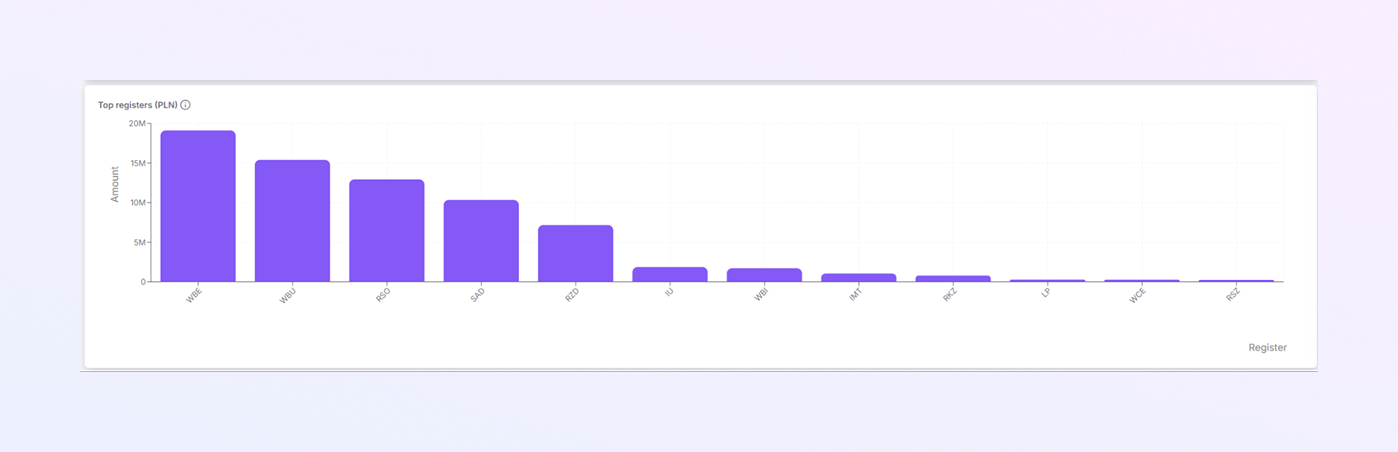
Top Registers (PLN)
This section highlights registers with the highest total value.
-
Bar chart showing total value by register.
-
Values are displayed in PLN.
-
Each bar represents one register.
This helps you quickly see which registers have the biggest financial impact.
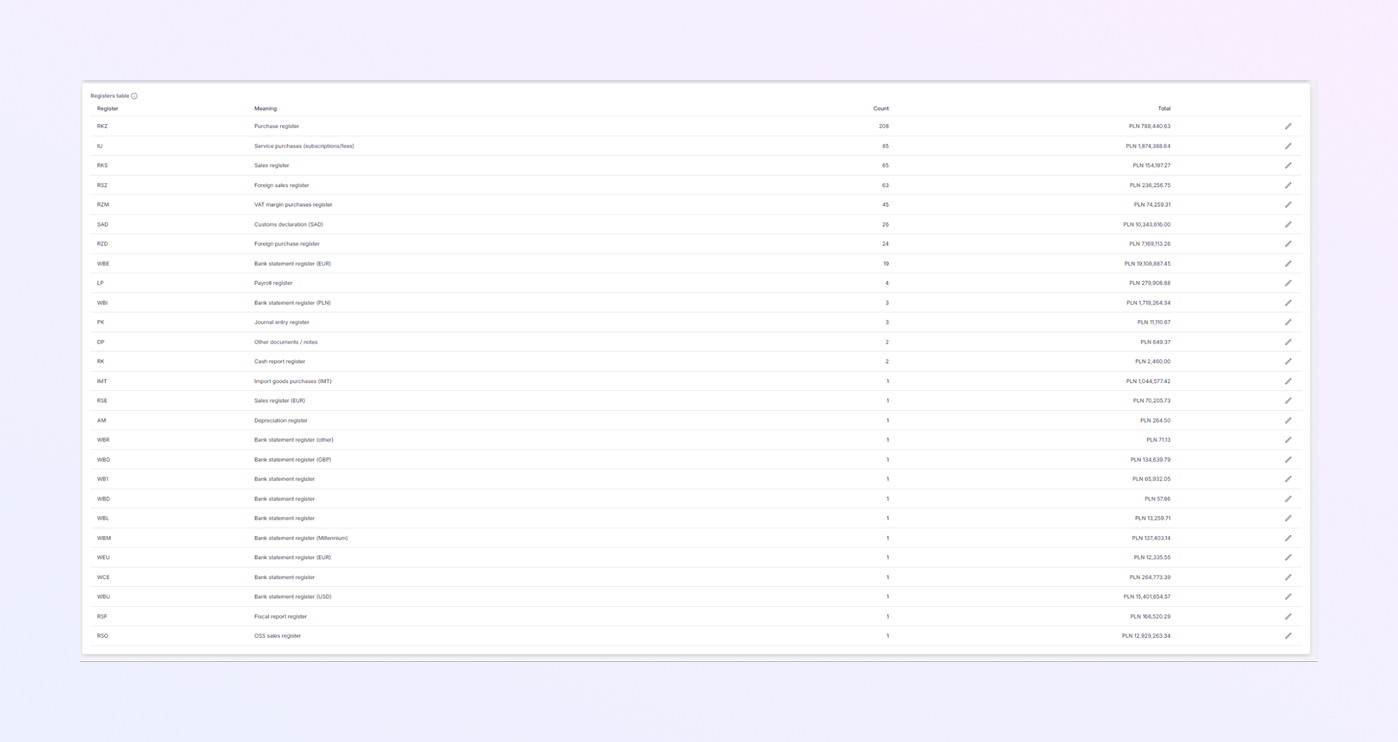
Registers Table
The table below shows detailed information for each register.
-
Register: Short register code used in accounting.
-
Meaning: Description of what the register is used for. Helps users understand the purpose of each register.
-
Count: Number of documents recorded in that register. Shows how often the register is used.
-
Total: Total financial value of documents in that register. Displayed in PLN accounting value.
Common Registers
-
RKZ (Purchase Register): Records supplier purchase invoices. Used to track purchases and costs.
-
IU (Service Purchases): Used for subscriptions, fees, and service costs.
-
RKS (Sales Register): Records domestic sales invoices.
-
RSZ (Foreign Sales Register): Records sales to foreign customers.
-
RZM (VAT Margin Purchases Register): Used for VAT margin accounting.
-
SAD (Customs Declaration): Records customs import documents. Often has high values due to import costs.
-
RZD (Foreign Purchase Register): Records purchases from foreign suppliers.
-
WBE / WBI / WBU (Bank Statement Registers): Used for bank transactions. Split by currency (EUR, PLN, USD).
-
LP (Payroll Register): Records payroll documents and salaries.
-
PK (Journal Entry Register): Used for manual accounting entries.
-
IMT (Import Goods Purchases): Used for imported goods under IMT rules.
-
AM (Depreciation Register): Records asset depreciation entries.
-
RSF (Fiscal Report Register): Used for fiscal device reports.
-
RSO (OSS Sales Register): Used for EU OSS (One Stop Shop) sales reporting.
How to Use the Registers Tab
-
Review the document flow by register
-
Check register completeness
-
Support VAT and tax reporting
-
Prepare audit data
-
Validate accounting structure
Bank
The Bank tab shows all bank statement registers and their totals. It helps you review bank activity, check balances by register, and support bank reconciliation.
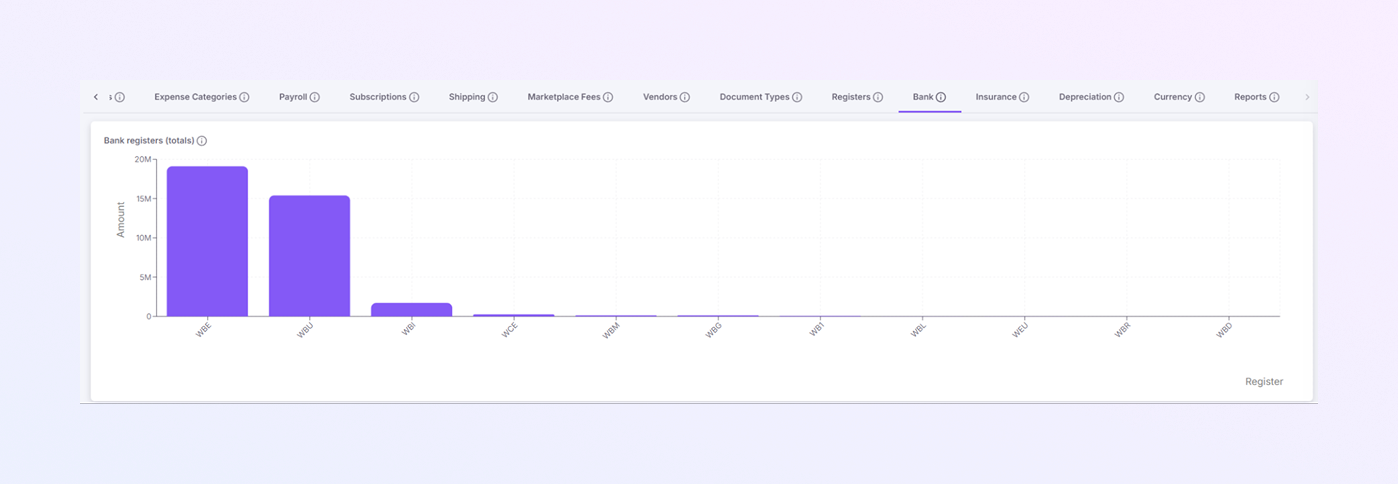
Bank Registers (Totals)
-
Bar chart displaying total amounts per bank register..
-
Values are shown in PLN.
-
Each bar represents one bank register.
This chart helps you quickly see which bank accounts handle the most money.
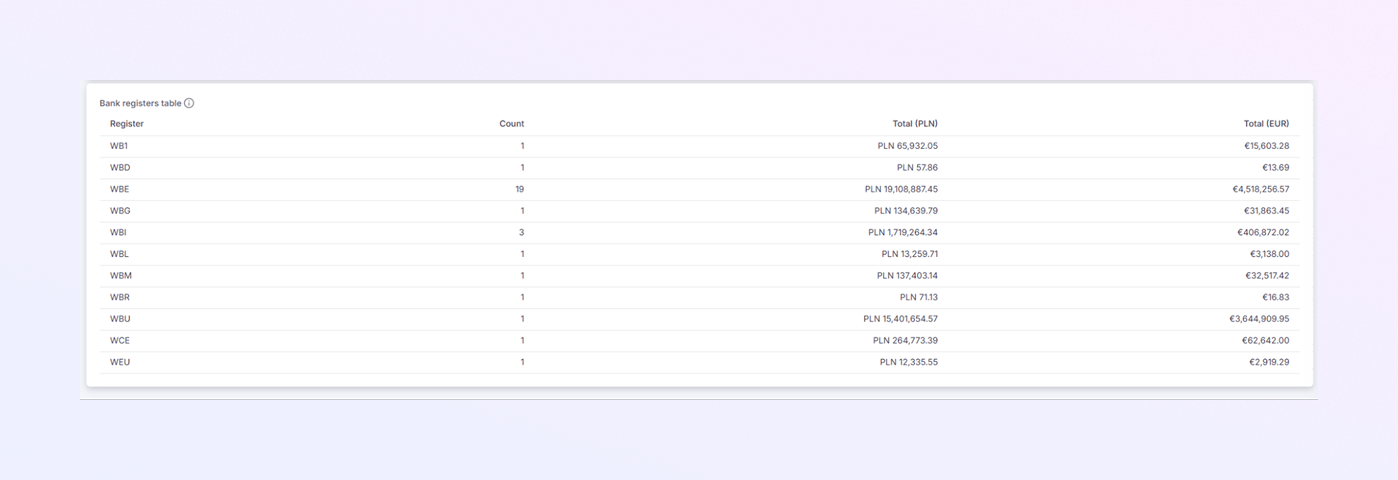
Bank Registers Table
Below the chart, a table shows detailed information for each bank register.
-
Register: Code of the bank register. Each register usually represents:
-
A specific bank account
-
Or a specific currency
-
-
Count: Number of bank statement documents in that register. Helps you understand transaction volume.
-
Total (PLN): Total amount recorded in the register, shown in PLN. Used as the main accounting value.
-
Total (EUR): Same total converted to EUR. Useful for international reporting and comparison.
Common Bank Registers
-
WBE: Bank statement register in EUR. Usually contains high transaction volumes.
-
WBU: Bank statement register in USD. Used for foreign currency transactions.
-
WBI: Bank statement register in PLN. Used for local payments and receipts.
-
WCE / WBM / WBG / WEU: Bank registers for specific banks or currencies. Used to separate accounts for accounting clarity.
-
WB1 / WBL / WBR / WBD: Additional or special-purpose bank registers. Often used for smaller or temporary accounts.
How to Use the Bank Tab
-
Review bank activity by account
-
Support bank reconciliation
-
Check if all bank statements are imported
-
Identify high-volume bank registers
-
Prepare data for audits
Insurance
The Insurance tab shows all insurance-related costs for the selected period. It helps you track how much is spent on insurance and supports cost control and compliance.
Insurance Totals
-
Total Insurance Cost (PLN): Shows the total amount spent on insurance. Displayed in PLN.
-
Business insurance
-
Product insurance
-
Liability or operational insurance (if applicable)
This value includes:

Depreciation
The Depreciation tab shows the total depreciation cost for company assets during the selected period. It helps you track asset value reduction for accounting and reporting purposes.
Depreciation Totals
-
Total Depreciation (PLN): Shows the total depreciation amount. Displayed in PLN.
-
Wear and tear of fixed assets
-
Gradual cost allocation of equipment, tools, or other assets
-
Accounting depreciation recorded for the period
This amount represents:

Currency
The Currency tab shows the distribution of transactions across different currencies. It helps you understand which currencies are being used and track financial exposure in foreign currencies.
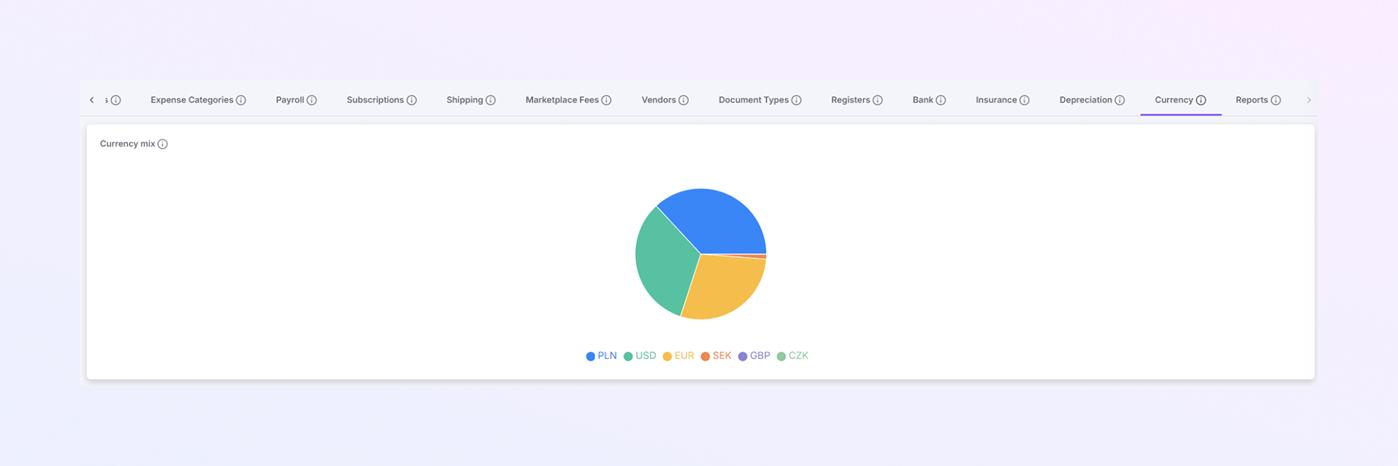
Currency Mix
-
Pie Chart: Displays the proportion of total transactions for each currency. Each slice represents a currency’s share of total financial activity.
-
Currencies displayed in the chart:
-
PLN: Polish Złoty
-
USD: US Dollar
-
EUR: Euro
-
SEK: Swedish Krona
-
GBP: British Pound
-
CZK: Czech Koruna
-
-
The chart helps you:
-
Quickly see which currencies are most used
-
Identify exposure to foreign currencies
-
Support currency conversion and reporting
-
Report
The Report tab allows you to generate and view comprehensive financial reports. It is designed to give you both high-level summaries and detailed exploration data for financial analysis.
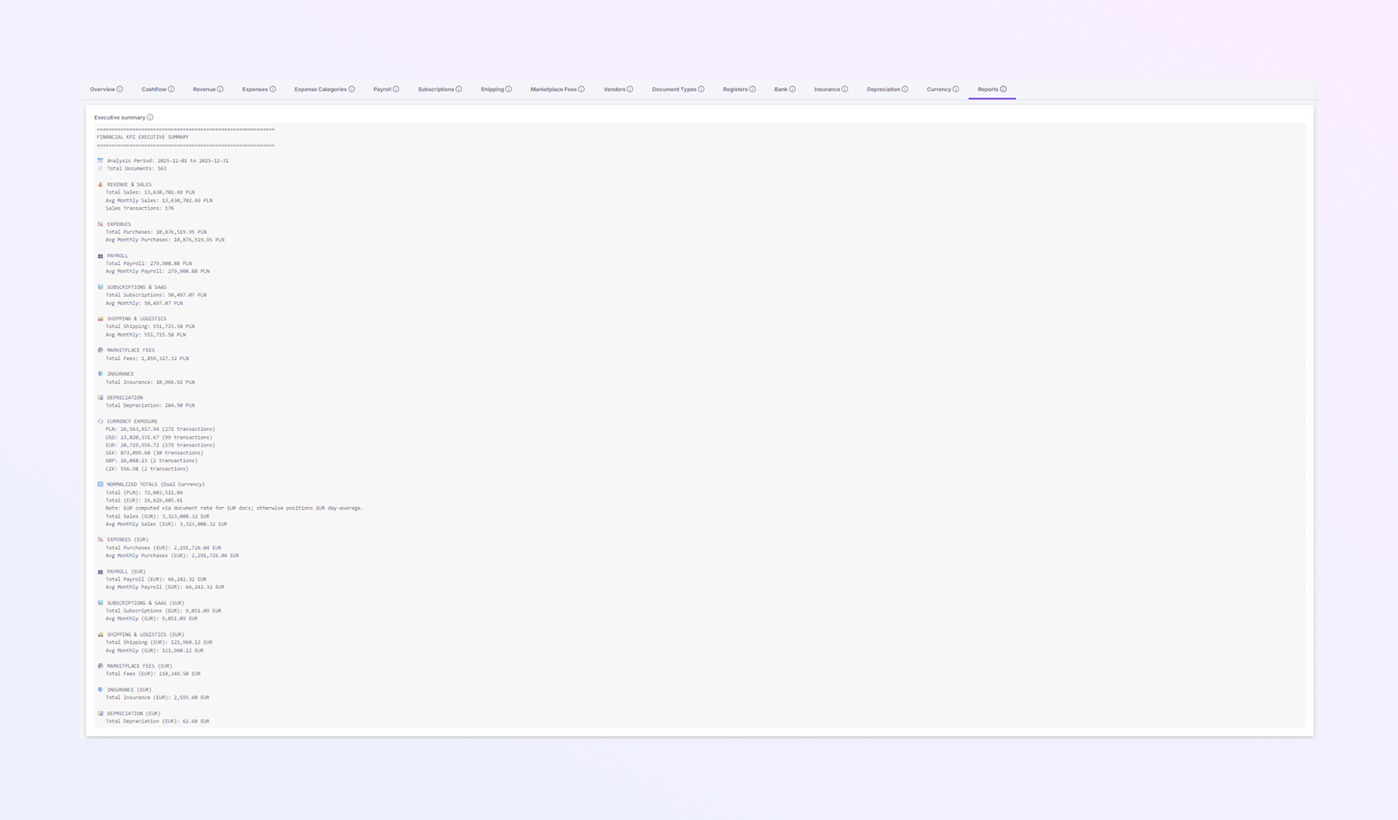
Executive Summary
-
The Executive Summary provides a quick overview of key financial performance indicators (KPIs).
-
It helps management and financial agents quickly understand the overall financial health of the company.
-
Key Points:
-
Shows total revenue, expenses, cash flow, and other KPIs
-
Highlights trends and critical metrics for decision-making
-
Useful for meetings, audits, and management reviews
-
Exploration Report
-
The Exploration Report provides a detailed, in-depth view of financial data.
-
It allows you to analyze the data behind KPIs, supporting deeper insights and investigations.
-
Report Details:
-
Generated on a specific date and time
-
Includes all financial records, transactions, and calculations
-
Can be exported or printed for further review
-
Useful for auditors, accountants, and finance teams
-

Summary
The Rewizor page helps you:
-
Review financial data clearly
-
Track sales, purchases, and costs
-
Analyze fees, payroll, and shipping
-
Prepare data for accounting and audits
This page is ideal for monthly reviews, financial control, and compliance checks.