

ExactFlow Performance Logs Page User Guide
The Performance Logs module in ExactFlow helps you track user actions and system events. You can see who did what, when it happened, and which order or action was involved.
The module has two main sections:
-
Performance Logs
-
Performance Metrics
How to Open the Performance Logs Page
Log in to your ExactFlow account.
Look at the left sidebar menu.
Click Performance Logs.
You will now see the Performance Logs dashboard.
Performance Logs Tab
This tab shows detailed, event-level logs of user and system actions. Each row represents one action or event.
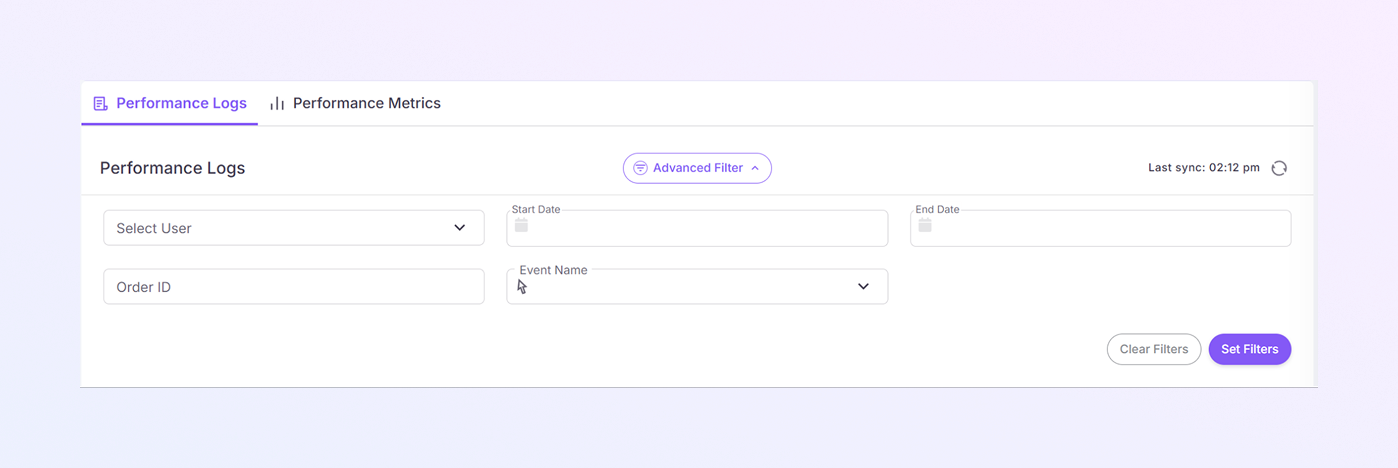
Top Filter Section
At the top of the page, you will find several filters. These filters help you narrow down the data and quickly find what you need.
-
Select User
Use this dropdown to choose a specific user.
When selected, only actions performed by that user will be shown.
Helpful when reviewing individual user activity.
-
Start Date
Choose the starting date for your search.
The system will show logs from this date onward.
Useful when checking activity for a specific time period.
-
End Date
Choose the ending date for your search.
Logs will be displayed up to this date.
Combine this with the Start Date for a custom date range.
-
Order ID
Enter a specific Order ID.
The table will only show actions related to that order.
Very helpful for order investigations or audits.
-
Event Name
Use this dropdown to select an event type.
Examples of events may include: Status changes
The list updates to show only the selected event.
-
Last Sync Information
At the top-right corner, you will see the last sync time.
This shows the last time system logs were updated.
Confirms that the data is current.
-
Set Filters Button
Click Set Filters to apply all selected filters.
The table updates immediately.
-
Clear Filters
Click Clear Filters to reset all selections.
The full log list will appear again.
Performance Logs Table
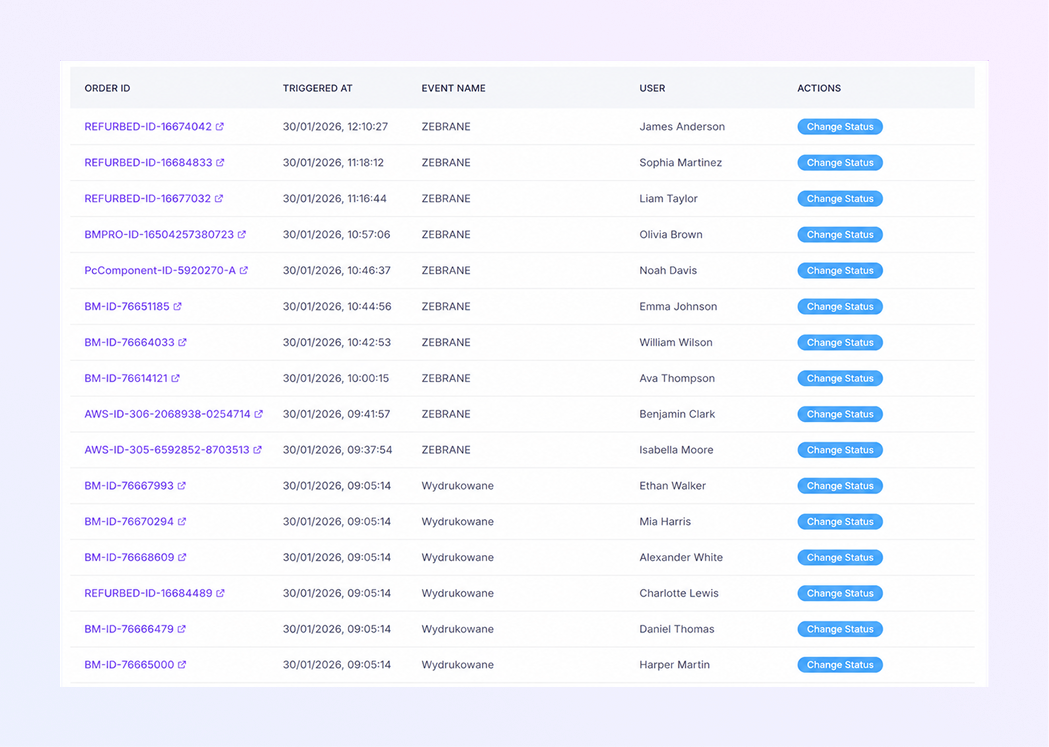
The table displays all recorded actions in an organized format.
Order ID
Shows the unique order reference.
Click the Order ID to open detailed order information.
Triggered At
Displays the exact date and time when the action happened.
Event Name
Shows the name of the action or event.
Helps you understand what action was performed.
User
Displays the name of the user who triggered the event.
Actions
Includes buttons like Change Status.
Allows quick follow-up actions directly from the log.
Performance Metrics Tab
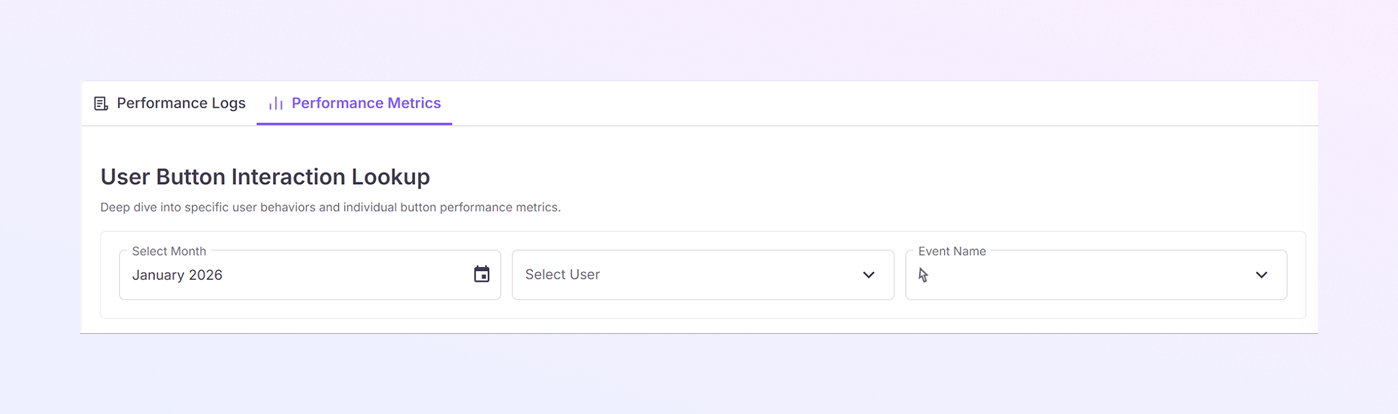
Click the Performance Metrics tab at the top of the page. This view shows aggregated data, not individual logs.
User Button Interaction Lookup
This section focuses on button clicks and user interactions.
It helps you understand:
How often are buttons used
Which actions are most common
User behavior trends
Filters in Performance Metrics
-
Select Month
Choose a month (for example, January 2026).
Metrics update based on the selected month.
-
Select User
Filter interaction data by a specific user.
Useful for performance review and activity tracking.
-
Event Name
Select a specific event or button action.
Metrics will reflect only that interaction.
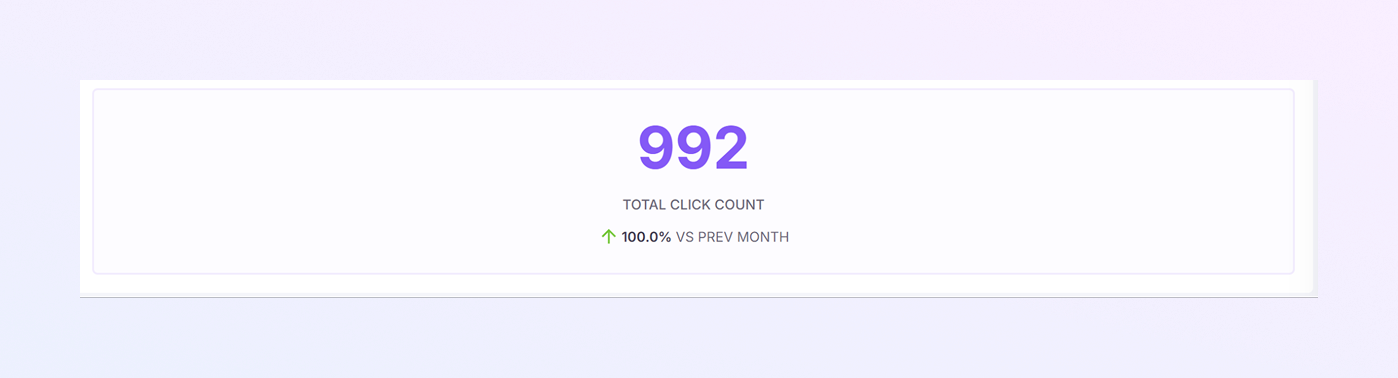
Total Click Count Card
This large number shows:
Total number of clicks for the selected filters.
Comparison with the previous month.
The green arrow indicates improvement or growth.
This helps managers quickly understand user activity trends.
When to Use Performance Metrics
Monthly performance reviews
User productivity analysis
Feature usage tracking
Identifying heavily used actions
Summary
The ExactFlow Performance Logs module helps you:
Monitor user and system actions
Track order-related events
Filter logs by user, date, event, or order
Review detailed activity records
Analyze user interaction metrics
Improve transparency and accountability
This page gives both detailed logs and high-level performance insights, making it a powerful tool for daily operations and audits.