

ExactFlow Monthly Revision Page User Guide
The Monthly Revision page helps you review how your team performed during a selected month. It brings together work hours, productivity, employee participation, and AI insights in one simple dashboard.
This page is mainly used by managers, team leads, and HR teams to understand performance trends and make better decisions.
How to Open the Monthly Revision Page
Log in to your ExactFlow account.
From the left sidebar, click Operational Agent.
Expand Performance Management.
click Monthly Revision.
The Monthly AI Analytics dashboard will open.
You are now viewing the Monthly Revision page.
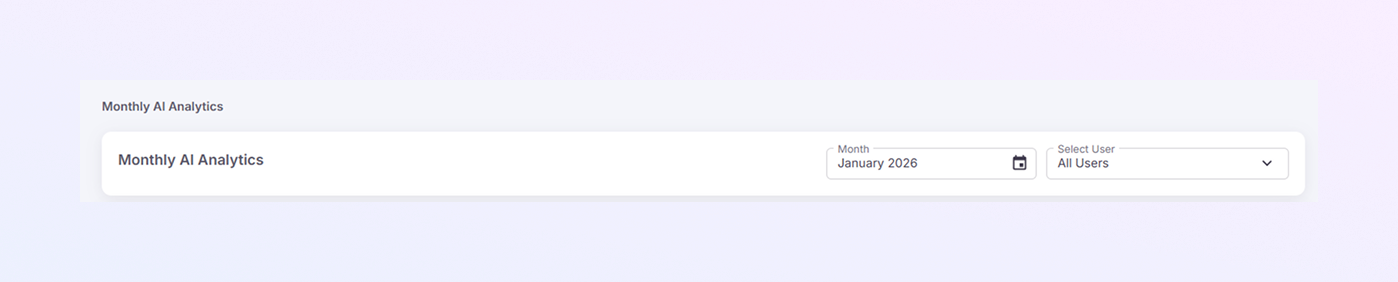
Top Controls Filters
At the top-right of the page, you will see two filters.
Month Selector
This lets you choose the month you want to review.
Example: January 2026
When you change the month, all data on the page updates automatically.
Use this to compare performance across different months.
User Selector
Default option: All Users
You can select a specific employee (if available).
The dashboard will then show data only for that user.
This is helpful when reviewing individual performance.
Monthly AI Analytics Overview Cards
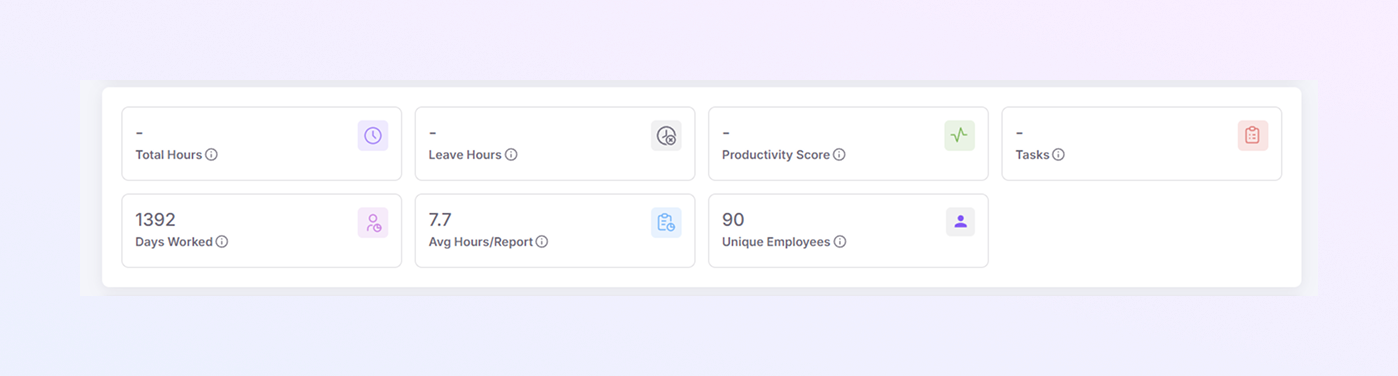
These small cards give you a quick summary of the selected month.
Total Hours
Shows the total working hours recorded.
If no data is available, it may appear as a dash (–).
Leave Hours
Displays total leave hours taken by employees.
Helps track time off during the month.
Productivity Score
A system-calculated score that reflects overall efficiency.
Higher scores mean better productivity.
Tasks
Shows the total number of tasks handled
Useful for workload tracking.
Days Worked
Displays the total number of working days logged.
Example: 1392 Days Worked
Average Hours per Report
Shows the average hours spent per report or task.
Helps understand effort distribution.
Unique Employees
Displays how many different employees contributed data.
Example: 90 Unique Employees
Workload Heatmap
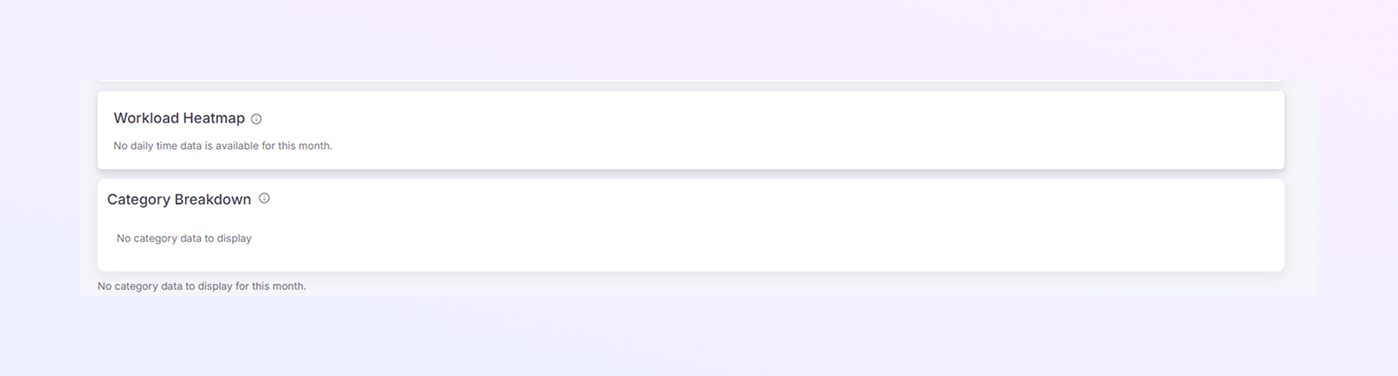
The Workload Heatmap section shows how work is spread across days.
It normally highlights busy and light workdays.
In this view, you may see:
“No daily time data is available for this month.”
This means daily time tracking was not recorded or is unavailable.
Category Breakdown
This section is used to show performance by task or work category.
Examples could include:
Support
Operations
Admin tasks
If you see “No category data to display”, it means:
Categories were not assigned, or
Data is not available for the selected month.
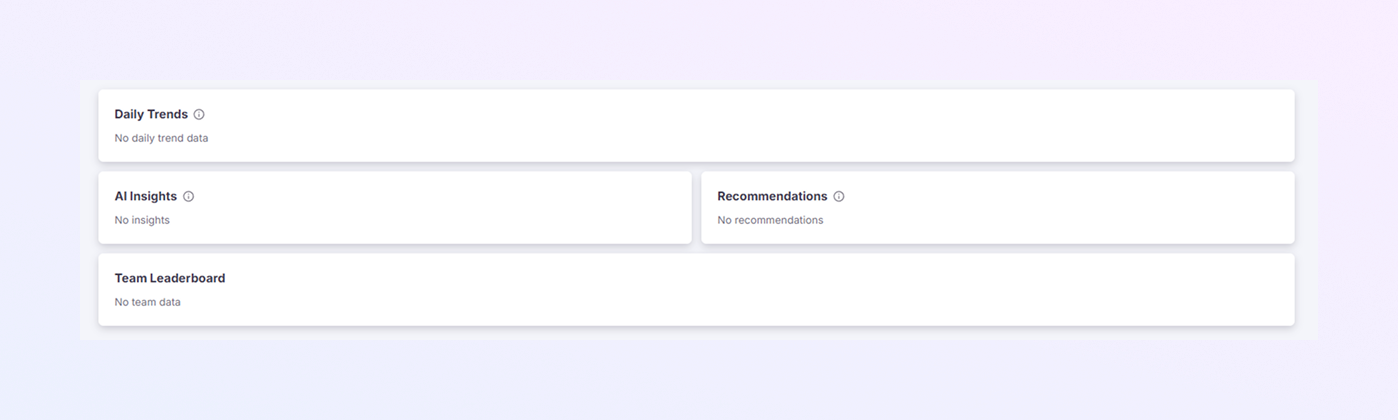
Daily Trends
The Daily Trends area tracks day-by-day performance changes.
It usually shows patterns in work hours or productivity.
If no data exists, you will see:
“No daily trend data”
This is normal for months with limited tracking.
AI Insights
This section is powered by ExactFlow’s AI.
It highlights:
Performance patterns
Unusual behavior
Improvement opportunities
If it shows “No insights”, it means:
The AI did not find any notable trends for the month.
Recommendations
Here, the system suggests actions based on the data.
Examples (when available):
Improve workload balance
Reduce overtime
Adjust team capacity
If you see “No recommendations”, no action is needed for now.
Team Leaderboard
The Team Leaderboard compares team or employee performance.
It helps identify:
Top performers
Participation levels
If it shows “No team data”, leaderboard information is not available for the selected month.
When Data Is Missing
Seeing empty sections does not mean something is broken.
It usually means:
The selected month has limited data
Time or task tracking was not enabled
No reports were submitted
Summary
The Monthly Revision page helps you:
Review monthly performance at a glance
Track working hours and productivity
Understand employee participation
View AI-generated insights and suggestions
Monitor trends without digging into reports