

ExactFlow Task Analytics Page User Guide
The Task Analytics page helps you track, understand, and improve how tasks are created and completed in ExactFlow. It gives you a clear picture of task progress, team performance, overdue work, and activity trends all in one place.
How to Open the Task Analytics Page
Log in to your ExactFlow account.
From the left sidebar, click Operational Agent.
Under Task Management, click Task Analytics.
The Task Analytics dashboard will now open.
Top Filter Bar
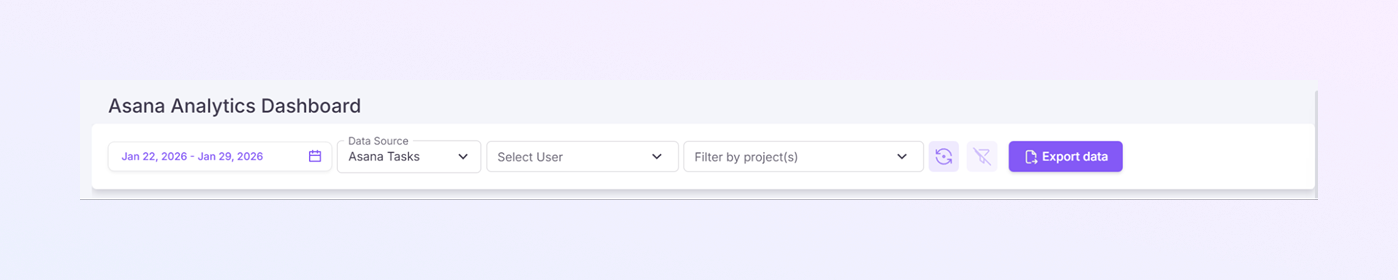
At the top of the page, you will see several filters. These help you control what data is shown.
-
Date Range Picker
You can select a start date and an end date.
The dashboard will show tasks only from the selected date range.
-
Use this to review:
Daily activity
Weekly performance
Monthly task progress
-
Data Source
This usually shows Asana Tasks and Non-Asana Tasks.
It tells you where the task data is coming from.
-
If more tools are connected in the future, you may be able to switch sources here.
-
Select User
Use this dropdown to view tasks for a specific team member.
When a user is selected:
All charts update to show only that user’s tasks.
-
Leave it empty to see all users.
-
Filter by Project(s)
Allows you to select one or more projects.
Only tasks linked to those projects will appear.
-
Helpful when reviewing project-specific performance.
-
Export Data Button
Click Export Data to download task data.
Useful for:
Reports
Audits
Sharing with stakeholders
Task Summary Cards
Below the filters, you will see four small summary cards.
-
Total Tasks
Shows the total number of tasks created in the selected time range.
Example: 688 tasks
-
Completed Tasks
Displays how many tasks are marked as completed.
Helps you measure productivity.
-
Completion Rate
Shows the percentage of completed tasks.
Calculated automatically by the system.
Example: 49.1% completion rate
-
Overdue Tasks
Displays tasks that are past their due date.
These tasks need immediate attention.

Task Status Distribution Chart
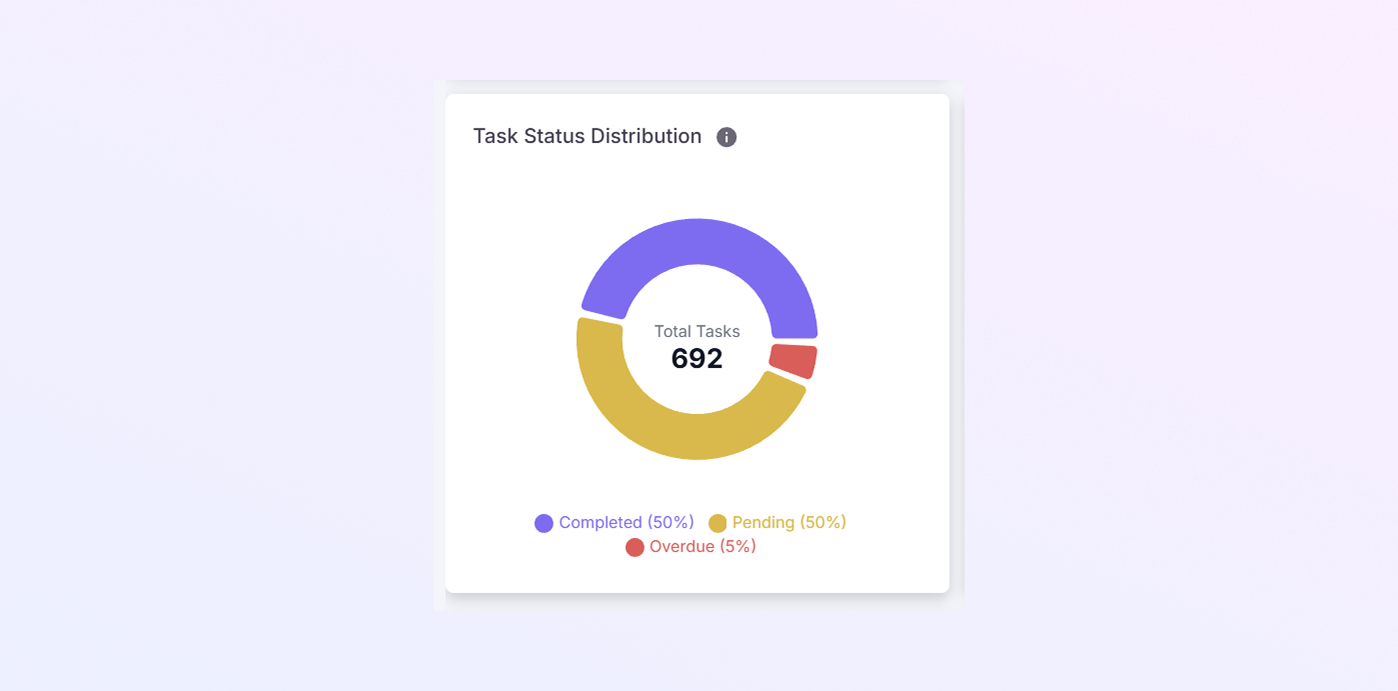
This section shows a donut chart that visually explains task status.
It Shows:
-
Completed tasks
-
Pending tasks
-
Overdue tasks
This is useful
-
You can quickly see where most tasks stand.
-
Makes it easy to spot delays or workload issues.
-
Colors help you understand status at a glance.
Recent Activity Graph
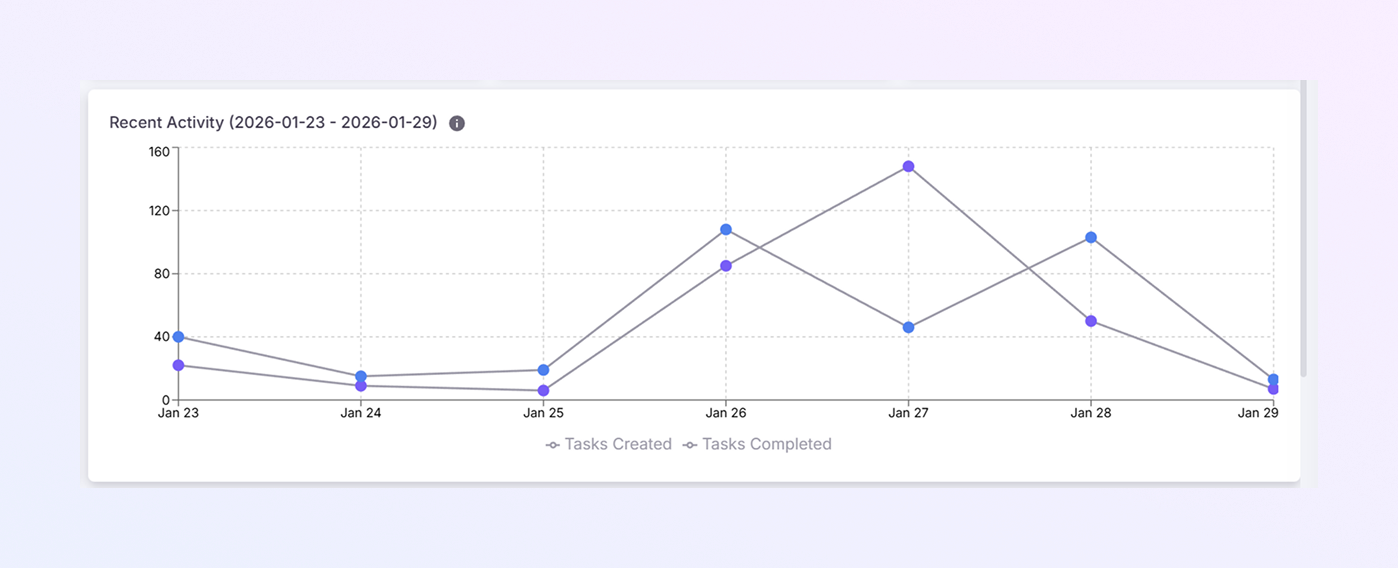
This line chart shows task activity over time.
You See
-
Tasks are created each day
-
Tasks completed each day
-
Dates shown on the bottom (X-axis)
-
Number of tasks shown on the side (Y-axis)
How to Use It
-
Compare task creation vs completion
-
Identify busy or slow days
-
Track team momentum and work patterns
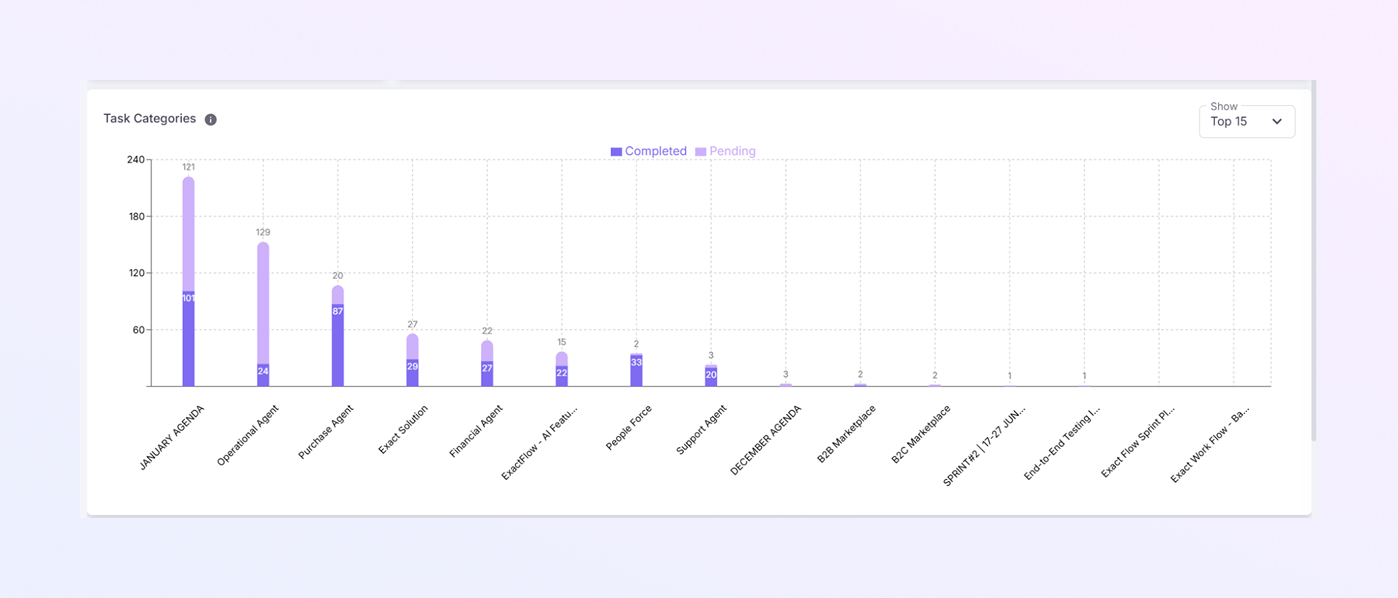
Task Categories Section
This bar chart shows tasks grouped by project or category.
Details Included
-
Number of completed tasks
-
Number of pending tasks
-
Project or category names are listed at the bottom
Show Options
-
You can choose how many categories to display (example: Top 15).
-
Helps focus on the most active projects.
Why It Mattersr
-
Identifies high-workload projects
-
Shows which projects are falling behind
-
Helps with task prioritization
Quick Summary Box
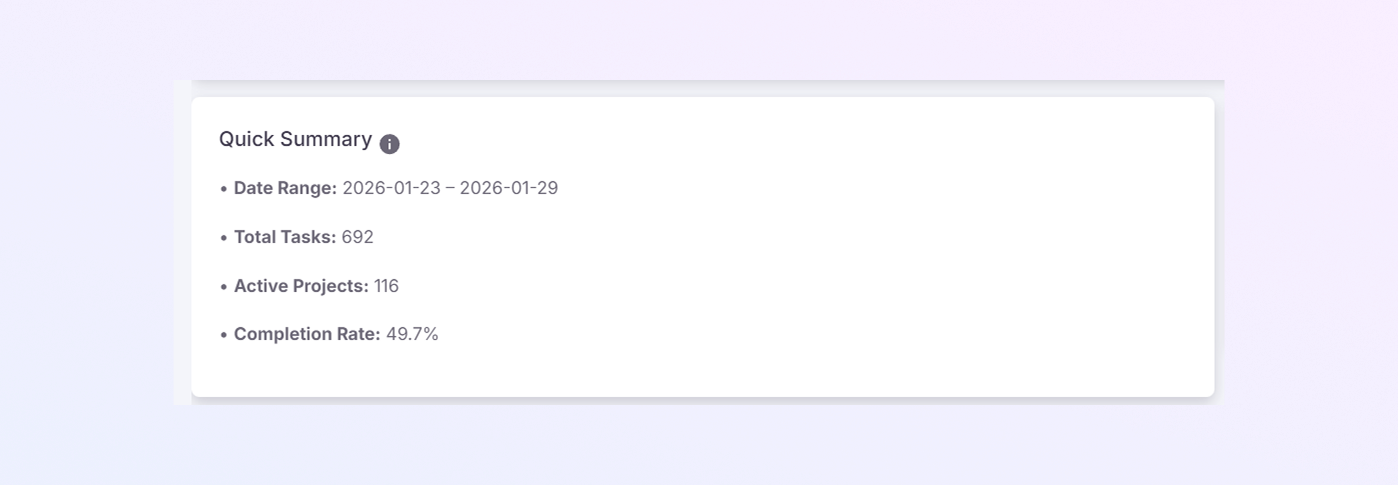
This section gives a short written summary of the selected data.
Information Included:
-
Selected date range
-
Total tasks
-
Active projects
-
Completion rate
This is useful when you want a fast overview without reading charts.
Performance Insights Section
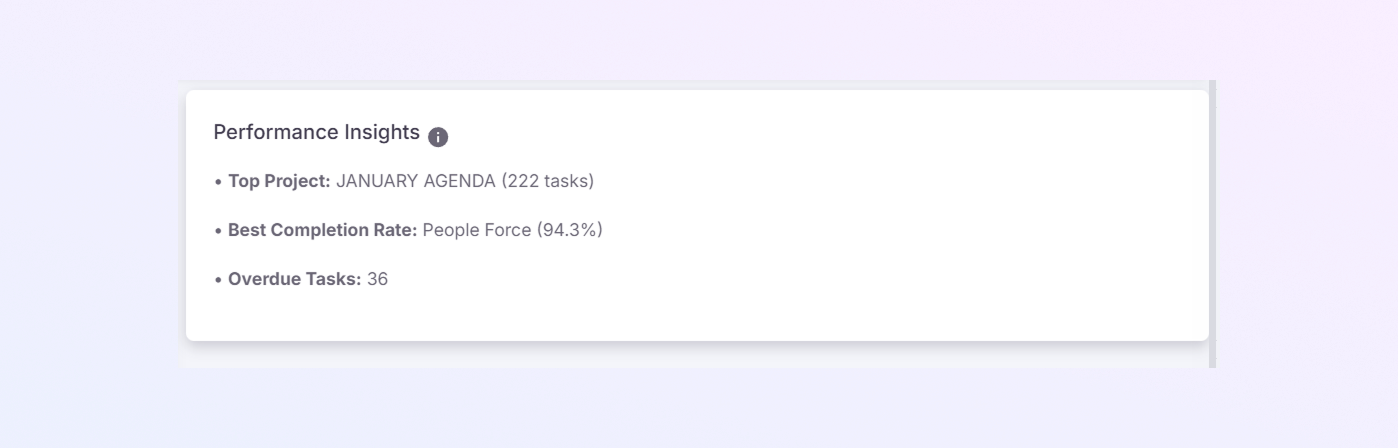
This section highlights key performance findings automatically.
Common Insights Shown
Top project based on the number of tasks
Best completion rate by team or project
Overdue task count
These insights help managers:
Recognize top-performing teams
Identify problem areas quickly
Make data-driven decisions
Summary
The ExactFlow Task Analytics page gives you full visibility into task performance.
You can:
Filter tasks by date, user, and project
Monitor completion and overdue tasks
Understand task trends with charts
Analyze performance with insights
Export data for reporting
This page is essential for keeping operations organized, efficient, and on track.