

ExactFlow User Analytics Page User Guide
The User Performance Analytics page helps managers and team leads track how users are performing on tasks. It shows task completion rates, pending work, overdue tasks, and productivity levels in one place.
How to Open the User Performance Analytics Page
Log in to your Exact Flow account.
From the left sidebar, click Operational Agent.
Click Task Management.
Click User Performance Analytics.
You will now see the User Performance Analytics dashboard.
Page Overview
The page is divided into four main sections:
-
Top Filters and Summary Cards
-
Performance Chart
-
User Performance Table
-
Performance Highlights
Each section gives you clear insights into task progress and user productivity.
Top Filters
At the top of the page, you will see several filters. These filters control what data appears on the page.
Sort By Filter
This dropdown lets you filter users based on task completion rate.
You can view:
-
Completion rate
-
Productivity
-
Total Tasks
-
Overdue Tasks
This helps you quickly find users who need attention.
Order Filter
This filter allows you to choose the order, such as:
-
Ascending
-
Descending
The page updates automatically when an order is selected.
User Type Filter
Use this dropdown to select user type, such as:
-
Asana Users
-
Non-Asana Users
-
Both Types
Users Selector
You can choose a specific user from the dropdown.
Date Range Selector
You can choose a specific date range (for example, weekly or monthly).
Use this to:
-
Review performance over time
-
Compare current and past performance

Summary Cards
Below the filters, you will see small summary cards showing key numbers.
These cards display:
Total Users: Shows how many users are included in the report.
Average Completion Rate: Displays the overall task completion percentage.
Top Performer: Shows the user with the highest performance during the selected period.
Users with Overdue Tasks: Indicates how many users have delayed tasks.
These cards give a quick snapshot of overall team health.

Performance Chart Section
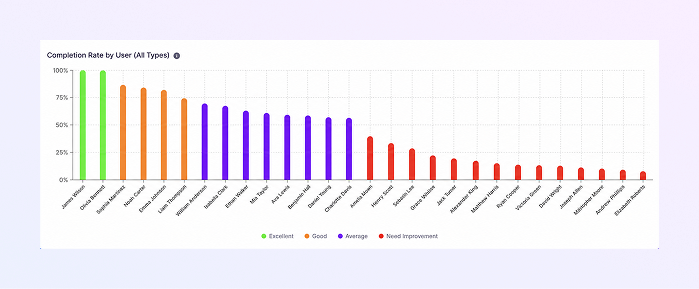
This section displays a bar chart showing user performance visually.
What the chart shows:
Each bar represents a user
Bar colors indicate performance levels
Completion percentage is shown clearly
Color meaning (commonly used):
Green: High completion rate
Orange: Average performance
Red: Low completion or delayed tasks
This chart helps you:
Compare users quickly
Spot performance gaps visually
User Performance Details Table
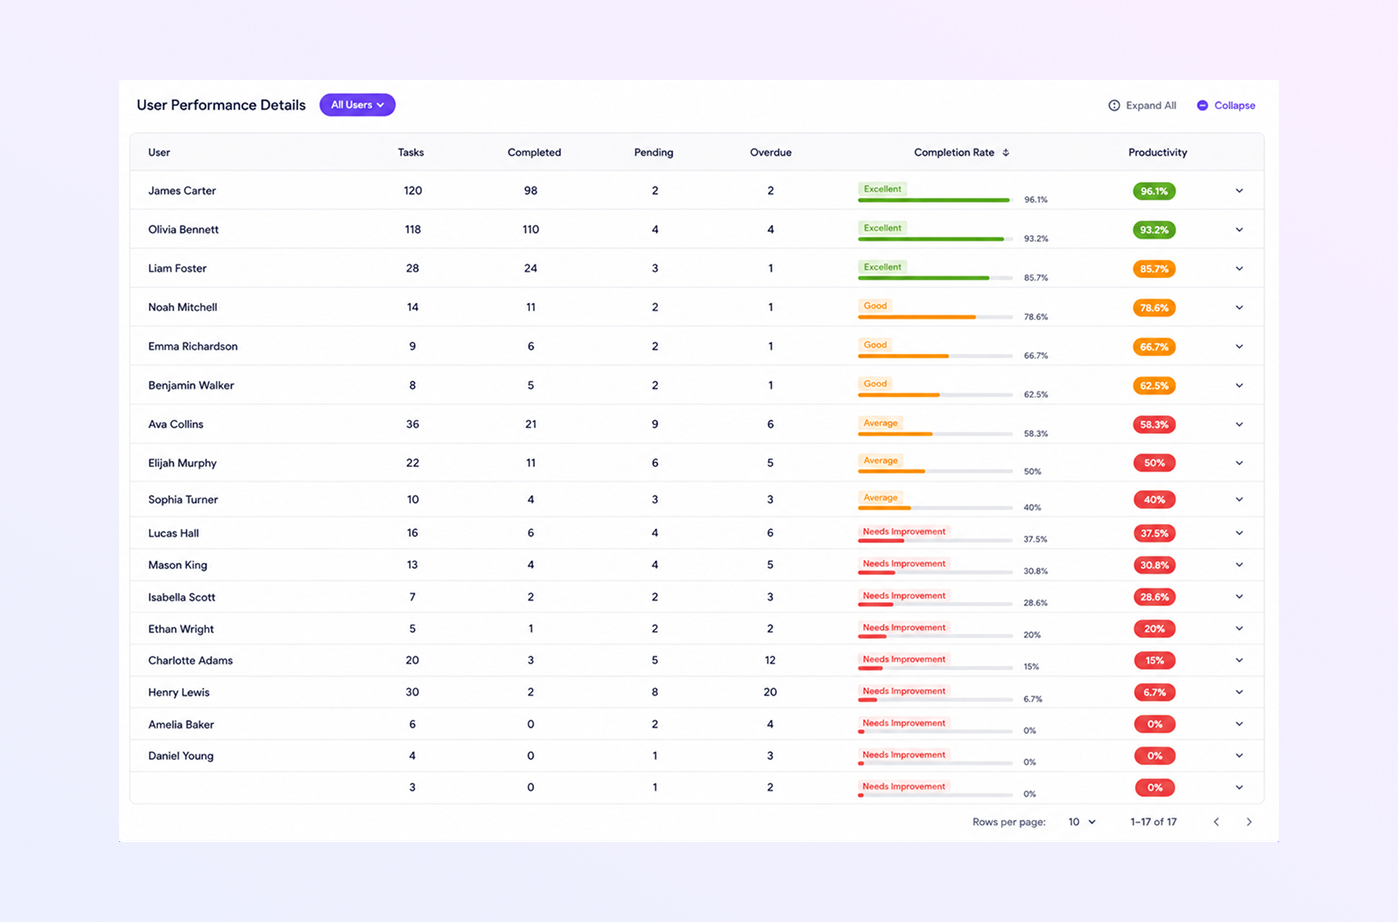
This is the main section of the page and shows detailed data for each user. Each row represents one user.
-
User: Shows User name & Profile icon. Helps you identify the team member easily.
-
Tasks: Displays the total number of tasks assigned to the user.
-
Completed: Shows the number of tasks completed successfully. This helps track productivity.
-
Pending: Displays tasks that are still in progress. Useful for workload monitoring.
-
Overdue: Shows tasks that passed their deadline. This column helps identify delays and risks.
-
Completion Rate (%): Shows the percentage of completed tasks. Color indicators help you understand performance quickly:
Green = Good
Orange = Average
Red = Needs improvement
-
Productivity: Displays productivity status using labels such as:
High
Medium
Low
This gives a simple performance summary for each user.
Performance Highlights
At the bottom of the page, you will see two key panels.
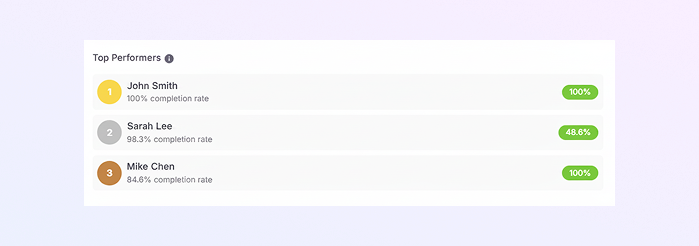
Top Performers Section
This section highlights users with:
-
High completion rates
-
Strong productivity
-
Recognize top contributors
-
Reward good performance
It helps managers:
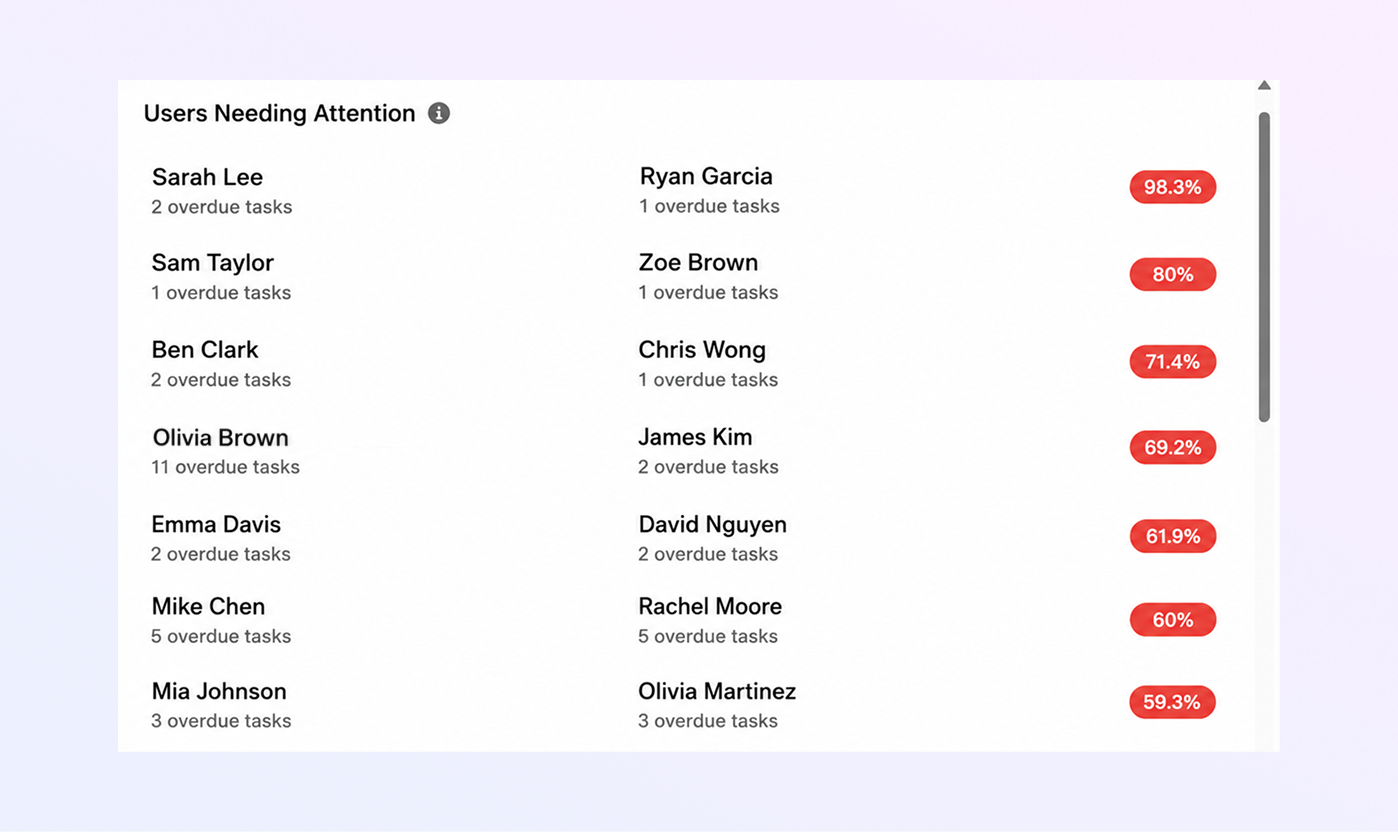
Users Needing Attention Section
This section lists users who:
-
Have low completion rates
-
Have many overdue tasks
-
Take early action
-
Provide support or guidance
It helps you:
Summary
With the ExactFlow User Performance Analytics page, you get:
Clear visibility of user task performance
Easy tracking of completed, pending, and overdue tasks
Visual performance comparison through charts
Quick identification of top performers and risk areas
Better decision-making for task management