


ExactFlow Support Dashboard Page User Guide
The Support Agent Dashboard is the primary screen for managing and tracking customer support tickets. It provides a comprehensive overview of performance, ticket assignments, and team activities.
How to Open the Support Agent Dashboard
Log in to your ExactFlow account.
From the left sidebar, click on Support Agent.
This will take you to the Support Agent Dashboard page.
Page Overview
The Support Agent Dashboard has several important sections that give you an overview of your team's performance and ticket statistics.
Dropdown Menu (Top Section)
-
From the top dropdown menu, you can select:
-
All: To view data from all marketplaces.
-
Specific Marketplace: Choose a specific marketplace, such as:
-
Backmarket
-
PCComponents
-
Pixmania
-
Refurbed
-
-
-
You can also choose a date range to specify the time period for which you want to view data.
-
The dashboard will update to show information based on the selected marketplace and time period.

-
Key Performance Summary Cards
At the top of the dashboard, four summary cards display core metrics:
-
Total Tickets: Total number of support tickets created during the selected period.
-
Assigned: Tickets are currently assigned to support agents.
-
Overdue: Tickets that have exceeded their SLA or expected resolution time.
-
Completed: Tickets that have been successfully resolved and closed.
These cards give a quick snapshot of workload and performance.
-
-
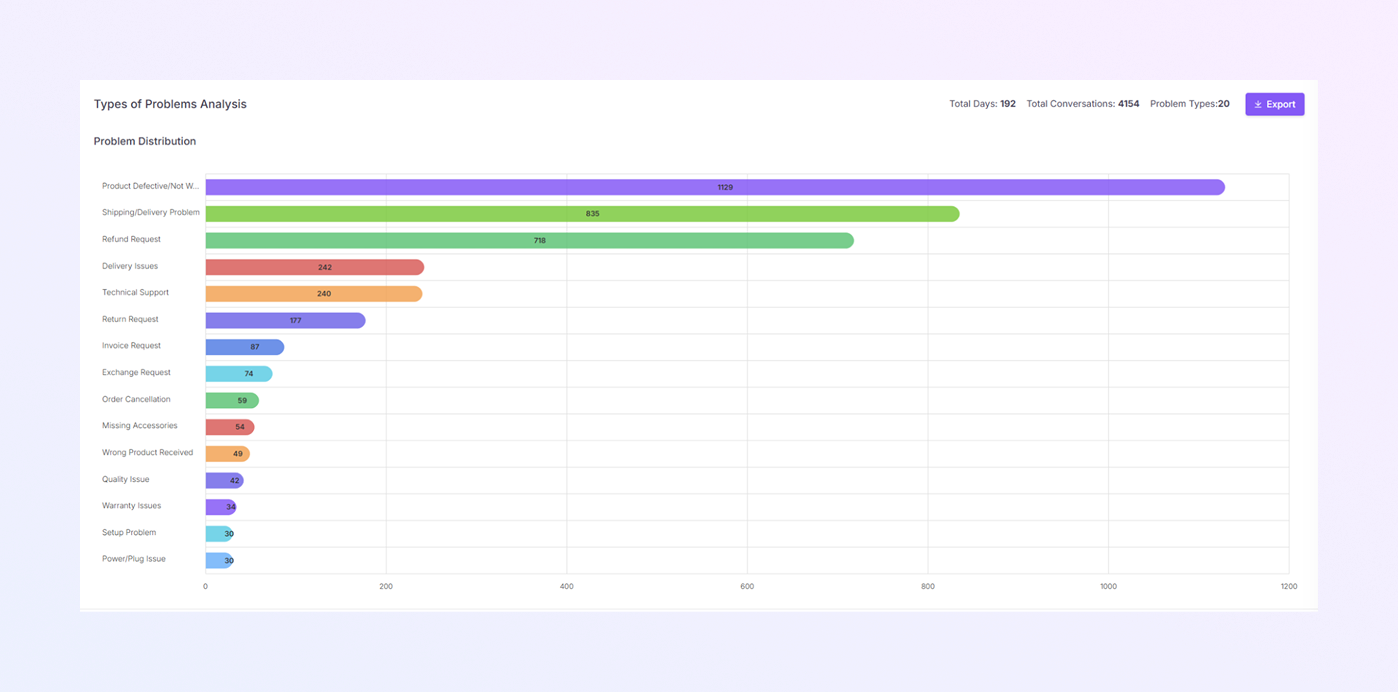
Types of Problem Analysis
This section provides a detailed breakdown of customer issues by category.
Header Metrics (Top-Right):
-
Total Days: Number of days included in the selected date range.
-
Total Conversations: Total customer conversations analyzed.
-
Problem Types: Number of unique issue categories.
-
Export Button: Download the data for reporting or further analysis.
Problem Distribution Chart
-
Horizontal bar chart showing the frequency of each problem type.
-
Problem categories are listed on the left.
-
Bar length and numeric labels indicate ticket volume.
-
Common Problem Categories, Such as:
-
Product Defective/Not Working
-
Shipping/Delivery Problem
-
Refund Request
-
Exchange Request
-
Technical Support
-
Missing Accessories
-
-
-
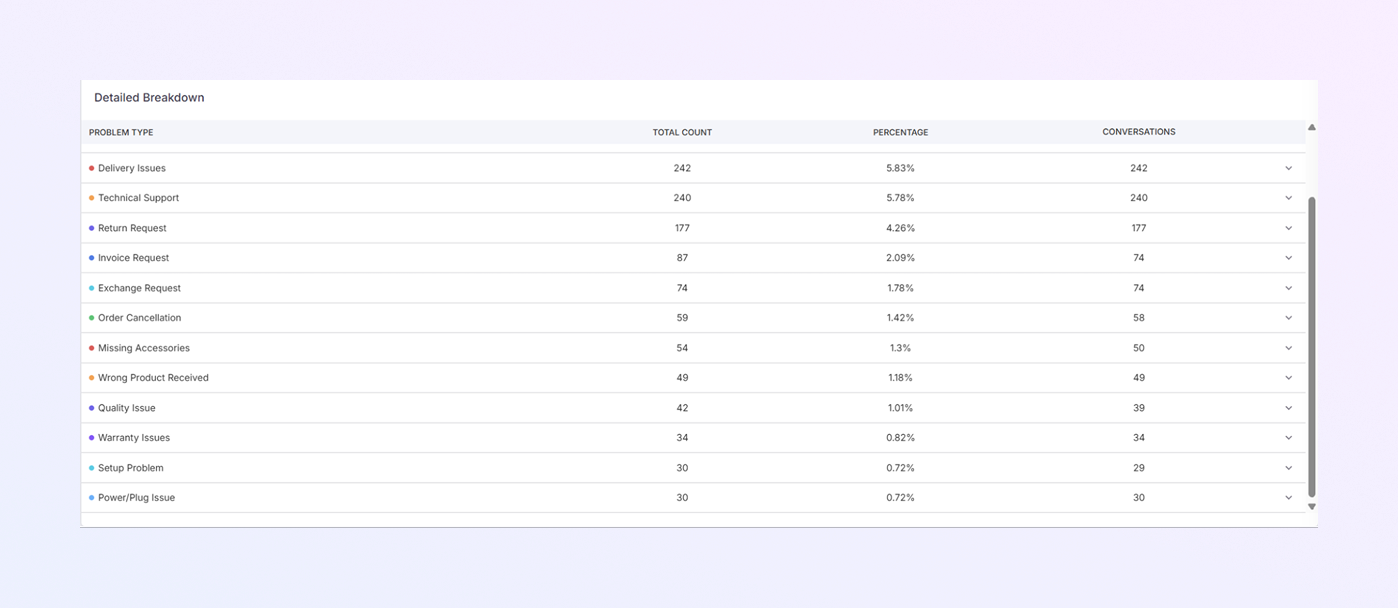
Detailed Breakdown
Below the problem categories, you will see a Detailed Breakdown that shows:
-
Total Count: The number of tickets for each problem type.
-
Percentage: The percentage of total tickets represented by each problem type.
-
Conversations: The number of conversations related to each problem type.
This section helps you understand the distribution of problems and how much each issue contributes to the total workload.
-
-
Response Rate & Total Tickets
This section shows key performance indicators:
-
Total Tickets: The total number of tickets for the selected period.
-
Responded Tickets: The number of tickets that have been answered by the support agents.
-
Response Rate: The percentage of tickets that have been responded to.
-
Avg Daily Tickets: The average number of tickets per day.

-
-
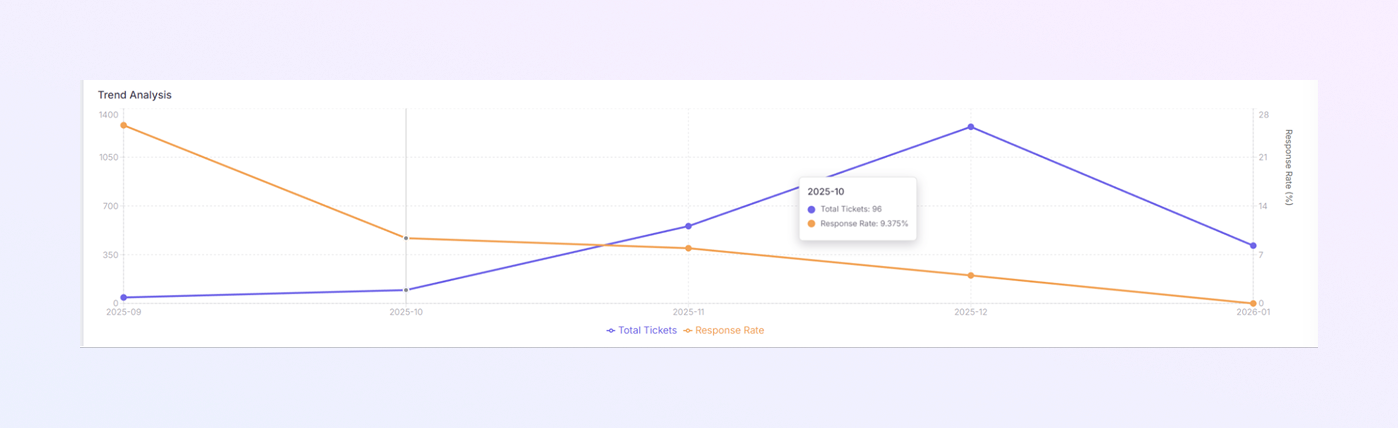
Trend Analysis
The Trend Analysis graph helps you track the overall performance over time. There are two lines on the graph:
-
Total Tickets (Blue Line): This shows how the total number of tickets has changed over the selected period.
-
Response Rate (Orange Line): This shows how the percentage of responded tickets has changed.
By analyzing this graph, you can see if the ticket volume is increasing or decreasing, and how quickly your team is responding to them.
-
-
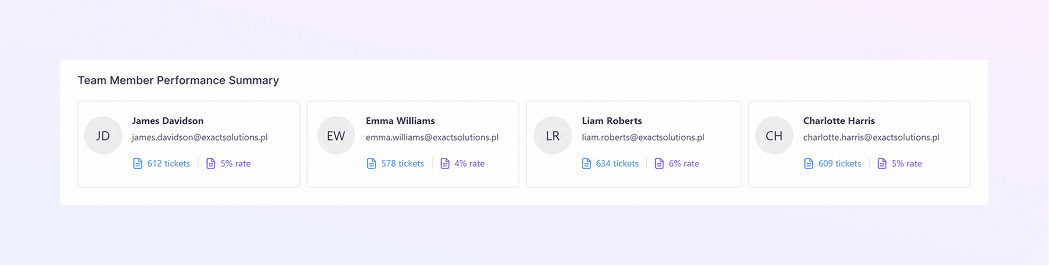
Team Member Performance Summary
Here, you can see how each team member is performing in terms of tickets handled and response rate. Each team member’s performance is displayed with:
-
Total Tickets: The number of tickets handled.
-
Response Rate: The percentage of tickets responded to.
You can easily spot which team members need help with ticket response rates.
-
-
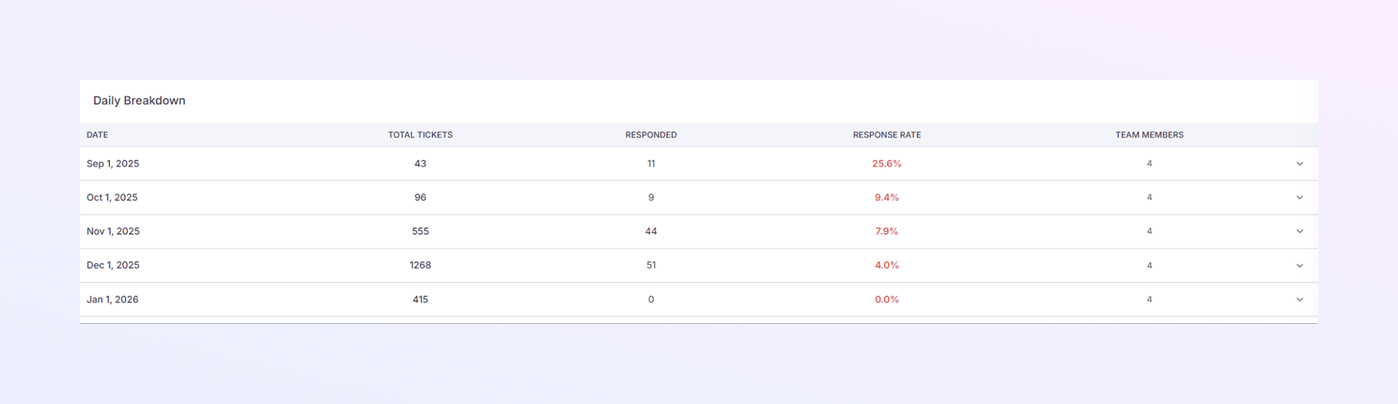
Daily Breakdown
The Daily Breakdown section shows how tickets have been handled on each day. For each date, you can see:
-
Total Tickets: The number of tickets created that day.
-
Responded: The number of tickets answered.
-
Response Rate: The percentage of tickets that were responded to on that day.
-
Team Members: Total number of team members who responded on that day.
This section helps you track daily performance and identify trends or issues with ticket handling.
-
-
Tech Support Employee Assignment Analysis
In this section, you can see how tickets are assigned to each team member. It shows:
-
Total Tickets: Total number of support tickets created.
-
New Tickets: Tickets that are newly assigned.
-
Waiting Tickets: Tickets that are still in progress.
-
Overdue Tickets: Tickets that have not been responded to on time.
This gives you insight into how your team is managing their workload and helps ensure no tickets are being overlooked.

-
-
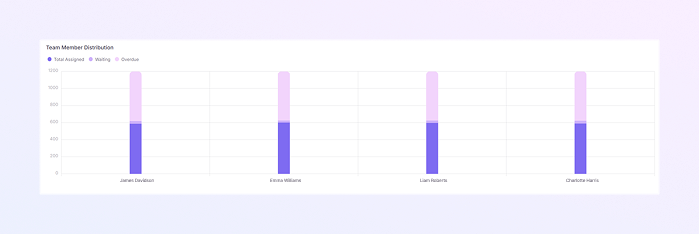
Team Member Distribution
The Team Member Distribution section shows how tickets are assigned among your team. For each team member, it displays:
-
Total Assigned: The total number of tickets assigned to the team member.
-
New Tickets: The number of newly assigned tickets.
-
Waiting Tickets: The number of tickets still being worked on.
-
Overdue Tickets: The number of overdue tickets.
This gives you insight into the workload of each team member and helps with resource allocation.
-
-
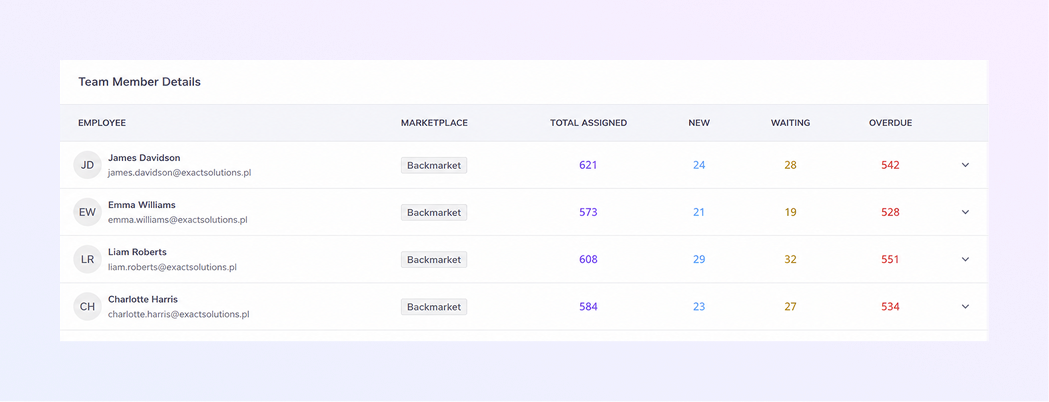
Team Member Details
The Team Member Details section provides a clear overview of each team member’s workload. For every team member, it displays the following information:
-
Employee: The team member’s name and work email address.
-
Marketplace: The marketplace(s) where the team member handled tickets.
-
Total Assigned: The total number of tickets assigned to the team member.
-
New Tickets: The number of tickets recently assigned.
-
Waiting Tickets: The number of tickets currently in progress or awaiting resolution.
-
Overdue Tickets: The number of tickets that have passed their due date.
This section helps you quickly assess individual workloads and make informed decisions about resource allocation.
-
-
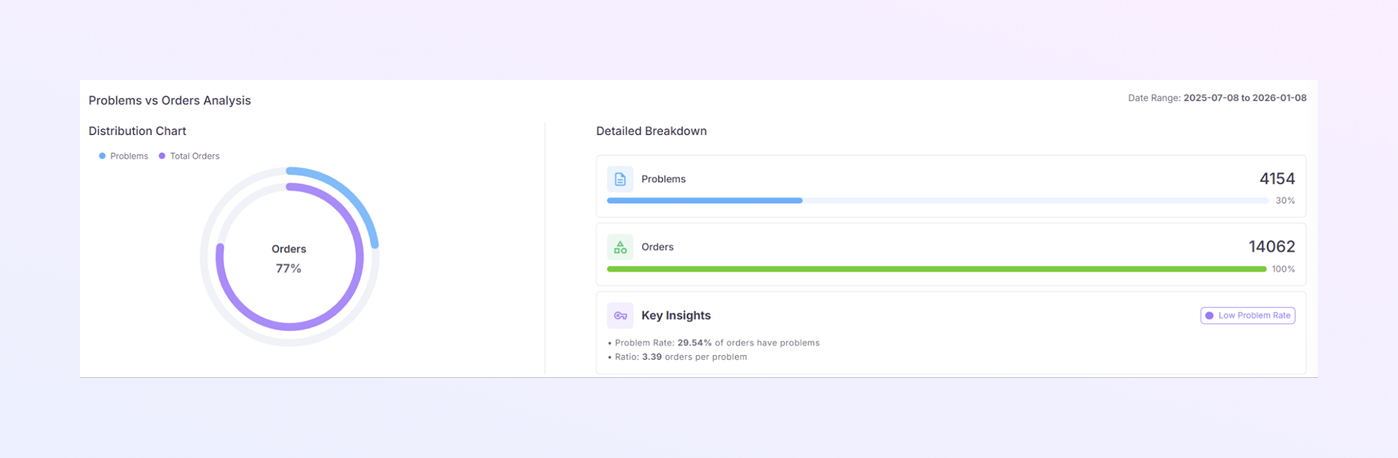
Problems vs Orders Analysis
This section shows a comparison between:
-
Problems: The total number of problem-related tickets.
-
Orders: The total number of orders.
This helps you see the proportion of tickets that are related to problems versus general orders.
-
-
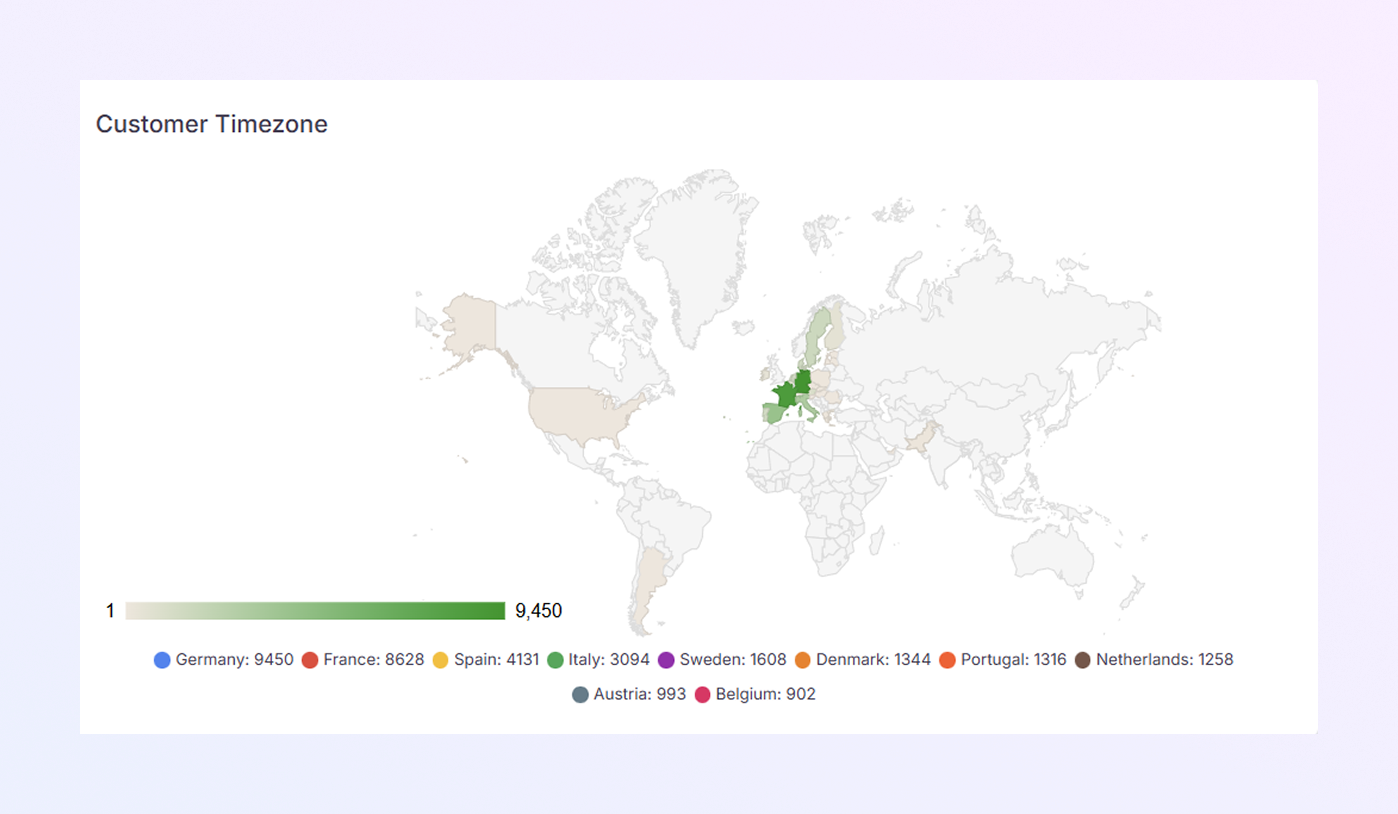
Customer Timezone
This section shows the customer distribution by timezone on a map. It helps you understand where your customers are located and adjust your response strategies based on regions.
-
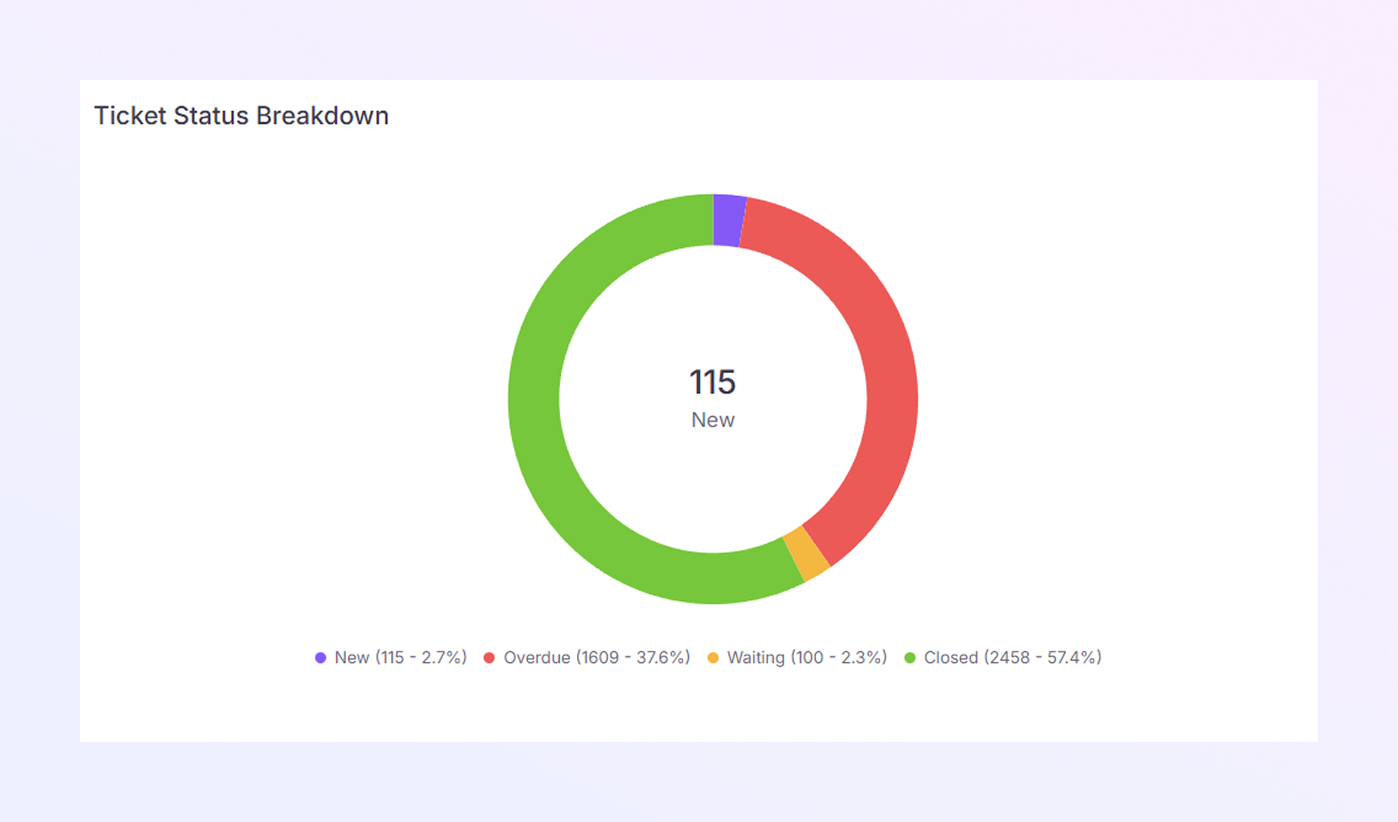
Ticket Status Breakdown
The Ticket Status Breakdown section visualizes the different statuses of your tickets:
-
New: Tickets that are newly assigned and awaiting a response.
-
Overdue: Tickets that should have been responded to but are still open.
-
Waiting: Tickets that are being worked on but not yet resolved.
-
Closed: Tickets that have been resolved and closed.
This gives you a quick overview of your team's ticket statuses and helps ensure timely follow-ups.
-
-
How to Use the Dashboard Effectively
-
Monitor Agent Performance: Regularly check the Team Member Performance Summary to ensure your team is responding to tickets efficiently.
-
Identify Common Issues: Use the Types of Problems Analysis to spot recurring issues and focus your team's efforts where they’re needed most.
-
Track Daily Trends: Use the Daily Breakdown to identify if there are any dips or spikes in ticket response rates and adjust strategies accordingly.
-
Prioritize Overdue Tickets: Keep an eye on Overdue Tickets in the Tech Support Employee Assignment Analysis to prevent delays.
-

On this page
1.
How to Open the Support Agent Dashboard
2.
Page Overview
3.
Key Performance Summary Cards
4.
Types of Problem Analysis
5.
Detailed Breakdown
6.
Response Rate & Total Tickets
7.
Trend Analysis
8.
Team Member Performance Summary
9.
Daily Breakdown
10.
Tech Support Employee Assignment Analysis
11.
Team Member Distribution
12.
Team Member Details
13.
Problems vs Orders Analysis
14.
Customer Timezone
15.
Ticket Status Breakdown
16.
How to Use the Dashboard Effectively