

ExactFlow Forecasting Page User Guide
The Forecasting page is all about helping you plan what to order and when. It uses past sales data and other factors to predict future demand, so you know exactly what to stock up on
This page is helpful for:
Seeing which products are likely to sell
Spotting items that are moving fast
Keeping an eye on stock levels so you don’t run out
Making sure you're ordering in advance and not scrambling
How to Open the Forecasting Page
Log in to your ExactFlow account.
From the left sidebar, click Purchase Agent.
Click Forecasting.
You’re now in the Forecasting dashboard.
Forecast Dashboard Overview
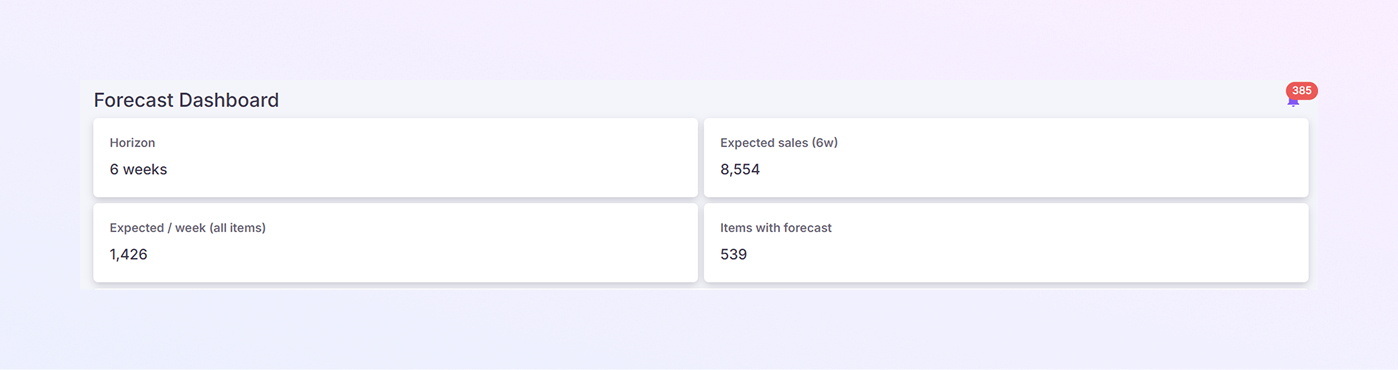
At the top of the page, you see summary cards. These cards give you a snapshot of your forecast and demand.
-
Horizon: How far ahead is the forecast looking? For example, 6 weeks means the system is predicting sales for the next six weeks.
-
Expected Sales: This indicates the number of units expected to be sold over the next 6 weeks.
-
Expected / week: A weekly average of how much will sell.
-
Items with forecast: The number of items that have enough data for a forecast.
Forecast Tabs
There are three tabs below the summary card:
Forecast
Trending
Alerts
Each tab serves a different purpose.
Forecast Tab
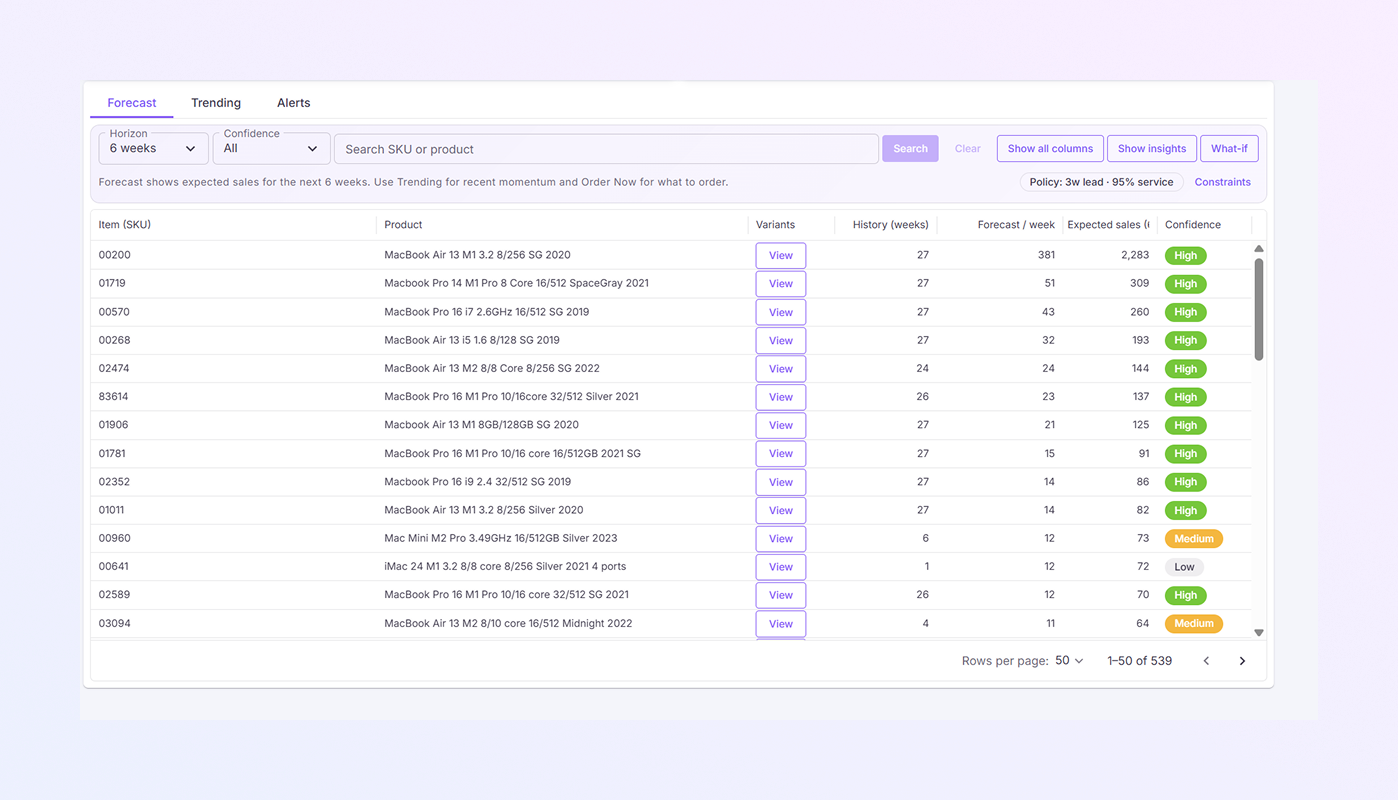
This tab shows expected sales per SKU.
Top Filters
You can control what appears on the page using filters.
-
Horizon Dropdown: Select the forecast duration. The table updates automatically.
-
Confidence Filter: Choose the forecast confidence level. This helps you focus on more reliable predictions.
All
High
Medium
Low
-
Search Bar: Search by SKU or product name. Useful when managing large catalogs.
Action Buttons
-
Search: Apply filters
-
Clear: Reset filters
-
Show all columns: View full table data
-
Show insights: Get system-generated insights
-
What-if: Test different forecast scenarios
Forecast Table
Each row represents one SKU.
Item (SKU): Unique product identifier.
Product: Full product name and specifications.
Variants: Click View to see product variations.
History (weeks): Number of past weeks used for forecasting.
Forecast/week: Expected weekly sales for that SKU.
Expected sales: Total expected units during the selected horizon.
Confidence: Reliability of the forecast:
Green: High
Orange: Medium
Medium
Grey: Low
This table helps you understand what will sell and how fast.
Trending Tab
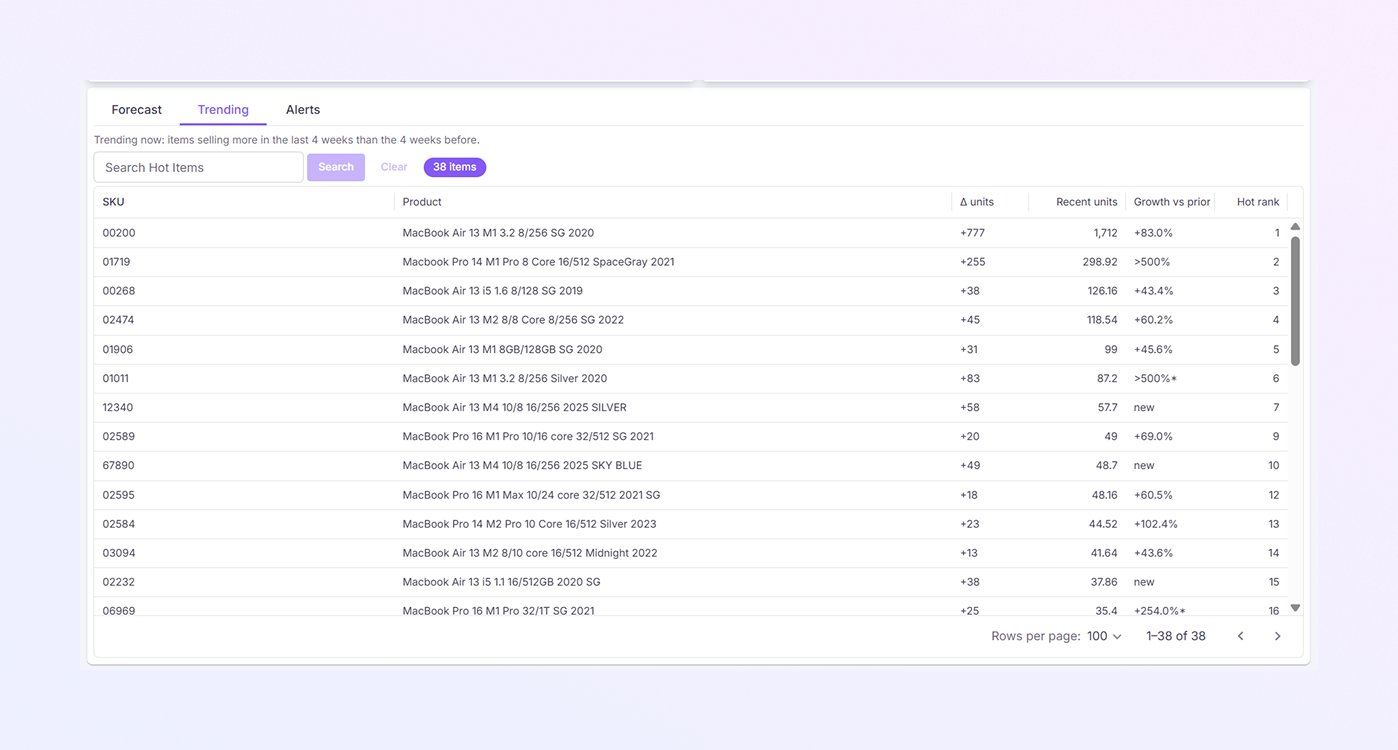
The Trending tab highlights products that are selling faster than before.
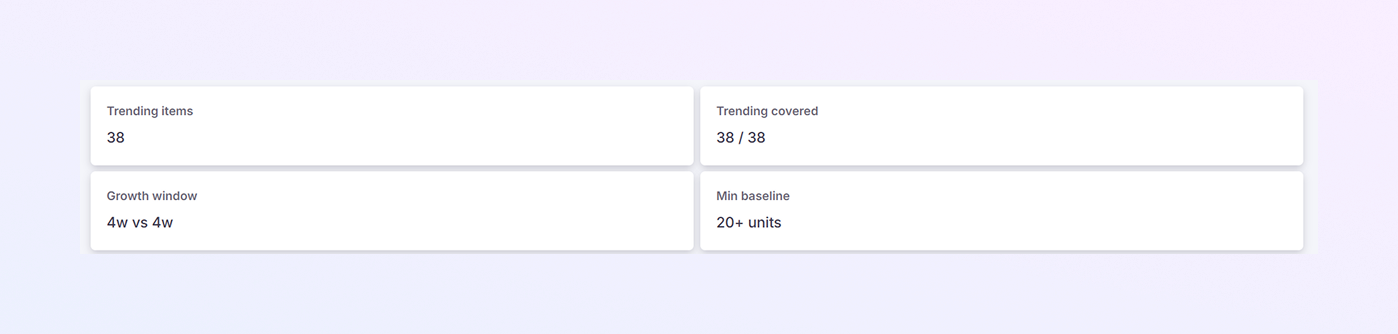
Top Summary Cards
-
Trending Items: Total number of SKUs with increasing sales.
-
Trending Covered: Shows how many trending items are included in the forecast.
-
Growth Window: Comparison period. For Example, the last 4 weeks vs the previous 4 weeks.
-
Minimum Baseline: Minimum sales required to be considered trending.
Trending Items Table
This table shows hot products.
-
SKU
-
Product
-
Units: Increase in units sold.
-
Recent Units: Sales in the most recent period.
-
Growth vs Prior: Percentage growth compared to earlier weeks.
-
Hot Rank: Rank based on growth strength.
Use this tab to spot fast-moving items, increase purchase quantities early, and avoid missing sudden demand spikes.
Alerts Tab
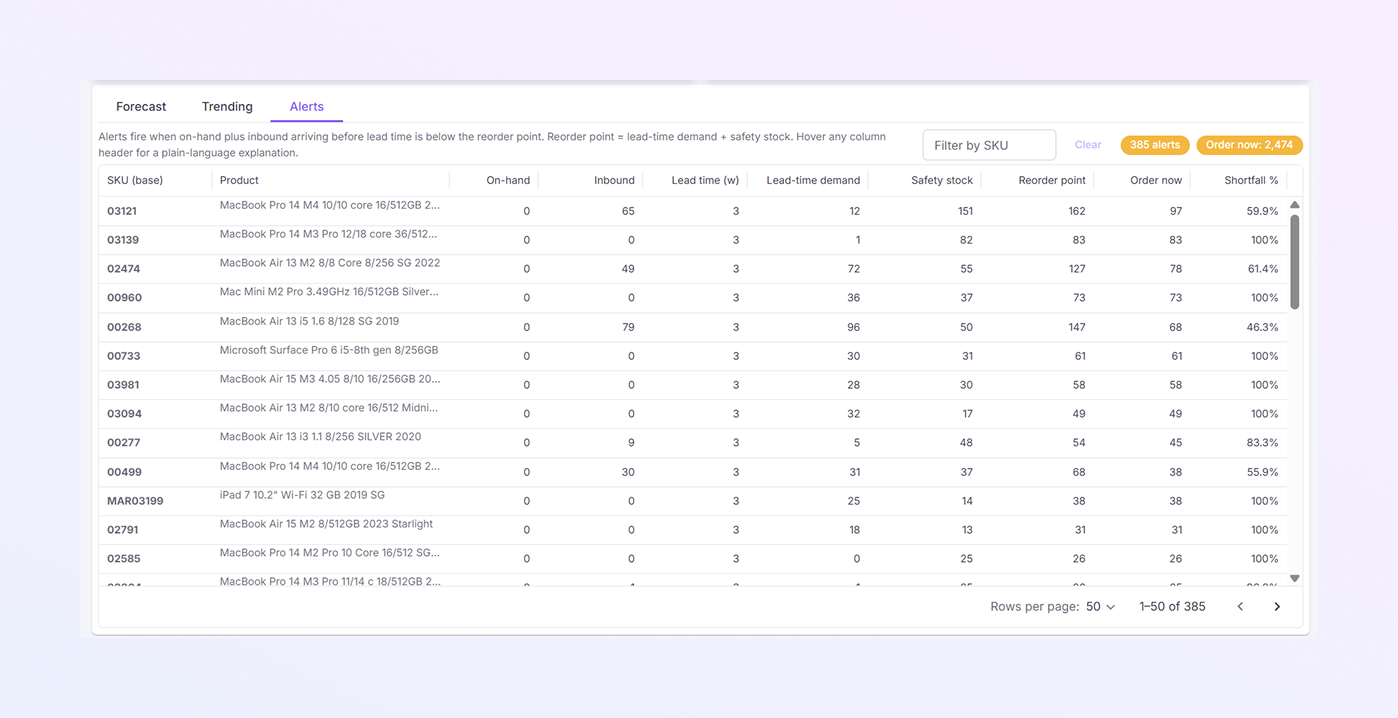
The Alerts tab tells you what needs to be ordered now.
Alerts are triggered when:
-
Stock + incoming inventory is below the reorder point
-
Lead-time demand is not covered
Top Summary Cards
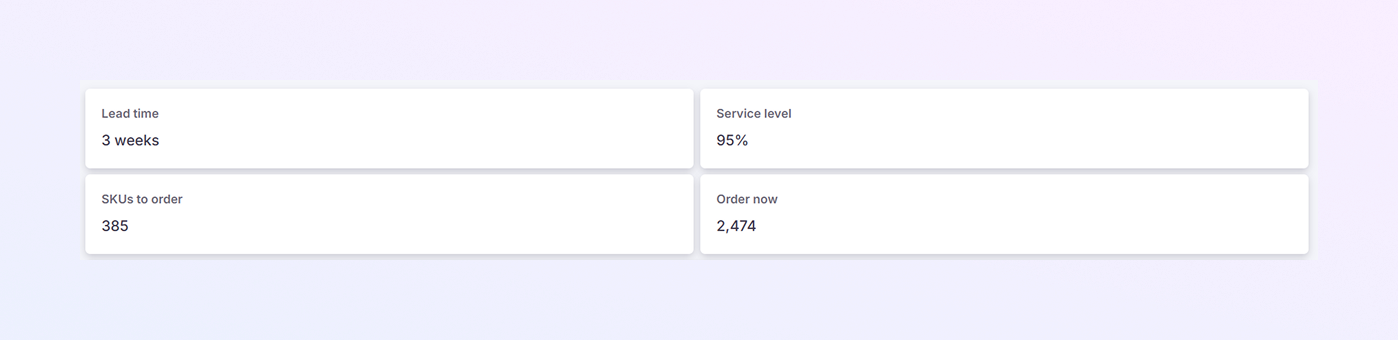
These summary cards appear at the top of the Alerts tab. They give you a quick overview of ordering urgency and inventory risk.
Lead Time
-
Shows how long it takes to receive inventory after you place an order.
-
Measured in weeks.
-
This value is used by the alert system to calculate risk and reorder timing.
-
A longer lead time means you need to order earlier.
Service Level
-
Shows how cautious the reorder calculation is.
-
Displayed as a percentage (for example, 95%).
-
A higher service level means more safety stock and a lower chance of stockouts.
-
A lower service level means less safety stock and a higher risk, but lower inventory holding.
SKUs to Order
-
Shows how many SKUs need replenishment.
-
A SKU appears here when:
-
On-hand stock
-
Plus inbound stock arriving within lead time
-
Is below the reorder point
-
-
This helps you quickly see how many products need action.
Order Now
-
Shows the total number of units you should order right now.
-
This number is calculated after:
-
Subtracting current on-hand inventory
-
Subtracting inbound inventory arriving within the lead time
-
-
The quantity is automatically:
-
Rounded to the minimum order quantity (MOQ)
-
Adjusted to pack sizes when available
-
-
This is the final, ready-to-place order amount.
Alerts Table
Each row shows one SKU at risk.
-
SKU (Base)
-
Product
-
On-hand: Current stock available.
-
Inbound: Units already ordered but not received.
-
Lead Time (w): Supplier delivery time.
-
Lead-time Demand: Expected demand during lead time.
-
Safety Stock: Extra stock to prevent shortages.
-
Reorder Point: Minimum inventory level required.
-
Order Now: Units recommended to order.
-
Shortfall %: How much inventory is missing.
Filters & Actions
-
Filter by SKU: Focus on specific items.
-
Clear: Reset the filter.
-
Alerts button: Show the total number of alerts.
-
Order now button: Quickly act on system recommendations.
This section is critical for daily purchasing decisions.
How Purchase Teams Use This Page
-
Plan weekly and monthly purchases
-
Identify risky SKUs early
-
Track fast-selling products
-
Reduce emergency orders
-
Improve supplier coordination
Summary
The ExactFlow Forecasting Page gives you:
-
Clear demand predictions
-
Easy-to-understand sales trends
-
Smart reorder alerts
-
Confidence-based forecasting
-
One place to plan purchasing decisions
With this page, purchase teams stay prepared, proactive, and in control without guesswork.