


ExactFlow Statistics Page User Guide
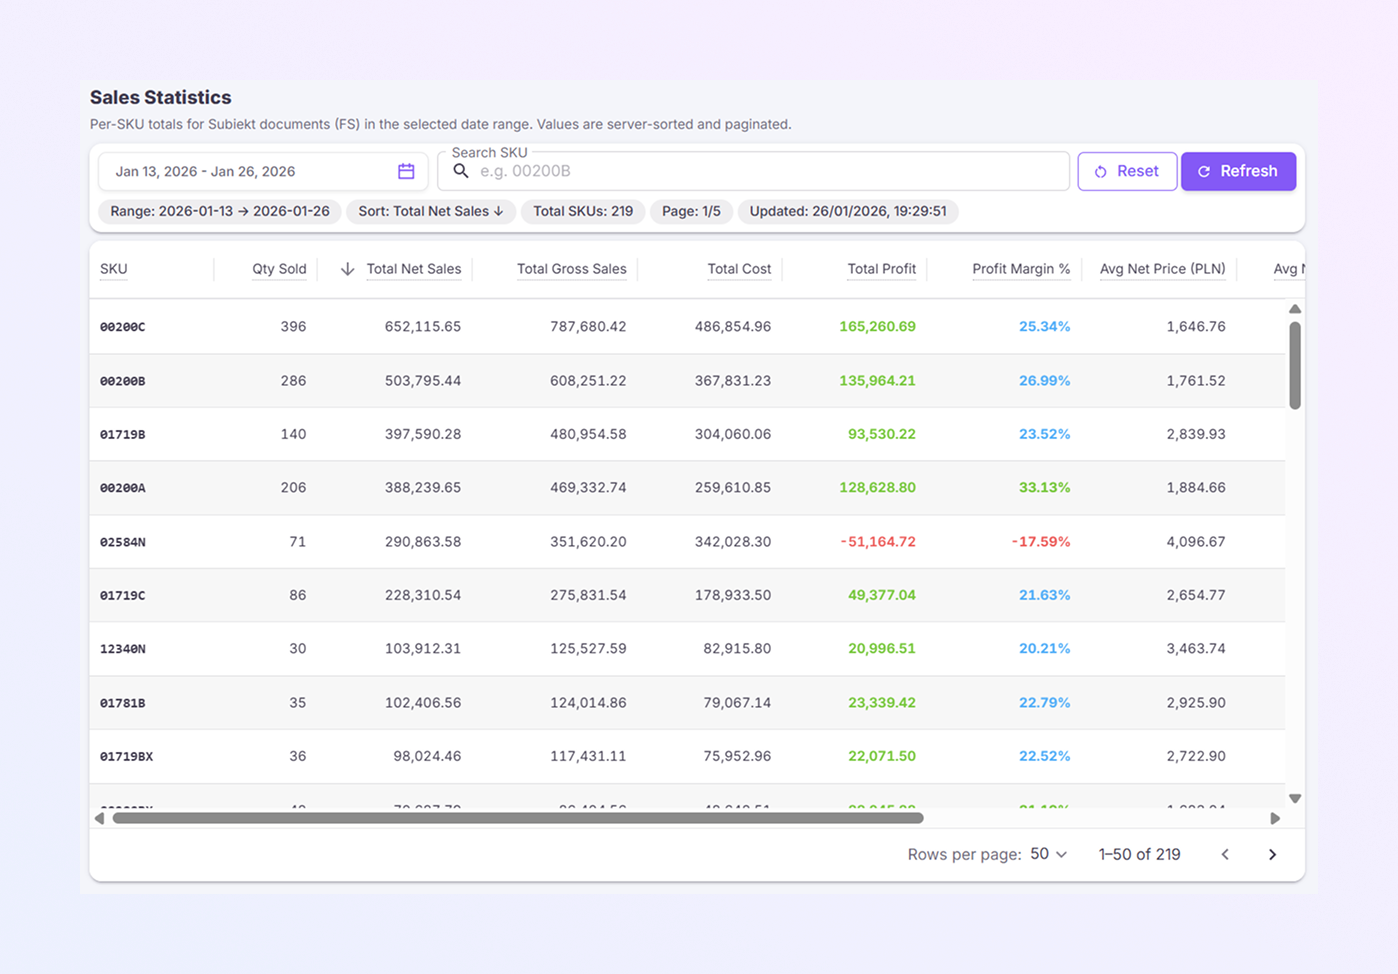
The Statistics page shows how products are selling over a selected time period. It breaks sales down by SKU and shows revenue, cost, and profit in one place.
This page is mainly used to understand which SKUs are selling well, which products are making a profit, where losses may be happening, and how sales look across a date range.
Purchase teams often use this page to support buying and planning decisions.
How to Open the Sales Statistics Page
Sign in to your Exact Flow account.
From the left menu, open Purchase Agent.
Click Statistics.
The Sales Statistics screen will open.
Filters and Controls
At the top of the page, you’ll see a set of filters and buttons. These control what data is shown in the table.
-
Date Range Selector: You’ll see a date range. Select a start date and an end date. Only sales from the selected dates are included in the results.
-
Search SKU: This field lets you look up a specific SKU. The table updates based on your search. This is helpful when you’re checking one product instead of the full list.
-
Reset Button: Clears the selected date range and SKU search. Returns the page to its default view.
-
Refresh Button: Reloads the page. Pulls the latest sales data from the system.
Info Bar
Under the filters, you’ll see a small info strip showing:
Selected date range
Sorting method (for example: Total Net Sales)
Total number of SKUs
Current page number
Last updated date and time
This helps you quickly understand what you’re looking at.
Sales Statistics Table
The main part of the page is the table. Each row represents one SKU. You can scroll vertically to see more rows and horizontally to see all columns.
-
SKU: The product’s SKU code.
-
Qty Sold: Total number of units sold during the selected date range.
-
Total Net Sales: Revenue after discounts and adjustments.
-
Total Gross Sales: Revenue before deductions.
-
Total Cost: Total cost of goods sold for that SKU.
-
Total Profit: Profit amount for the SKU.
-
Green numbers mean profit.
-
Red numbers mean loss.
-
Profit Margin %: Profit shown as a percentage. Negative margins are shown in red.
-
Avg Net Price (PLN): Average selling price per unit in PLN, based on net sales.
-
Avg Net Price (USD): Average selling price per unit in USD, based on net sales.
-
Avg Purchase Price (PLN): Average purchasing price per unit in PLN, based on net sales.
-
Avg Purchase Price (USD): Average purchasing price per unit in USD, based on net sales.
How This Page Is Commonly Used
Teams usually check this page to:
-
Spot top-selling SKUs
-
Find products with negative profit
-
Compare sales volume against profit
-
Support purchase and restock decisions
-
Review performance over a specific time period
Things to Keep in Mind
-
Data only reflects the selected date range
-
Sorting changes how results are displayed
-
Profit values depend on accurate cost data
-
Refresh the page if the numbers look outdated.
Quick Summary
The Sales Statistics page helps you:
-
Review sales by SKU
-
Understand profit and margin performance
-
Track sales trends over time
-
Support smarter purchasing decisions