

ExactFlow Inventory Cost Price Page User Guide
Sales teams can better understand purchase costs, stock value, and the pricing health of inventory by using the Inventory Cost Price page. It shows cost prices, break-even prices, stock levels, and price distribution so you can make better pricing and sales decisions.
How to Open the Inventory Cost Price Page
Log in to your ExactFlow account
From the left sidebar, click Sales Agent
Click Inventory Cost Price
You will now see the Inventory Cost Price dashboard.
Top Summary Section
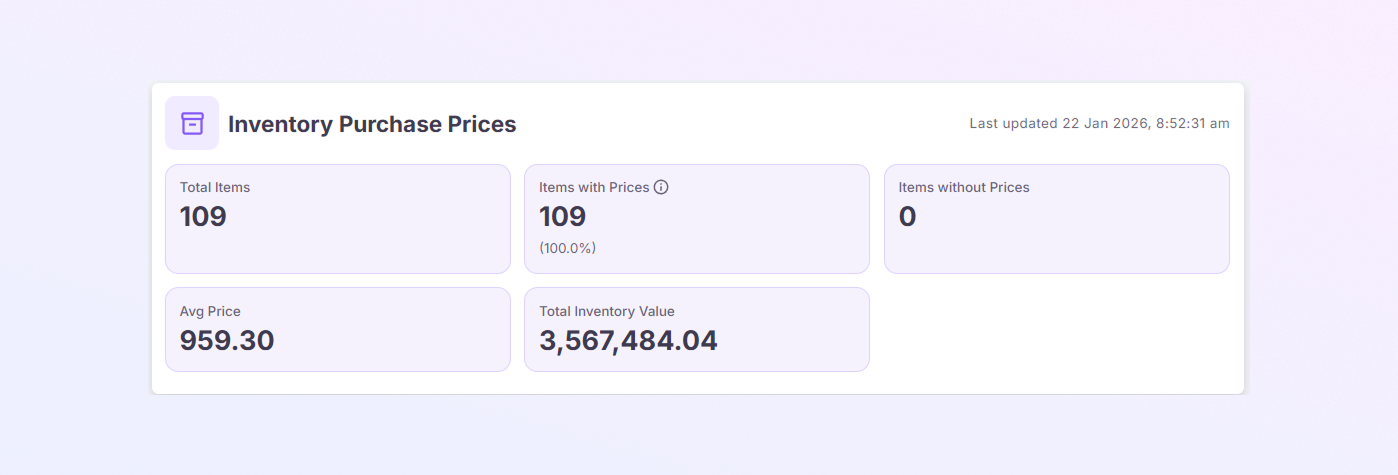
Summary cards that provide a quick overview of your inventory cost data are located at the top of the page.
-
Total Items: This page tracks the total number of inventory items.
-
Items with Prices: Number of items that already have purchase prices entered.
-
Items without Prices: Items missing purchase cost data.
-
Average Price: The average purchase cost of all items.
-
Total Value: The total inventory value is determined by the quantity of stock and purchase prices.
You can quickly understand inventory value and data completeness with the help of these cards.
Price Statistics Section
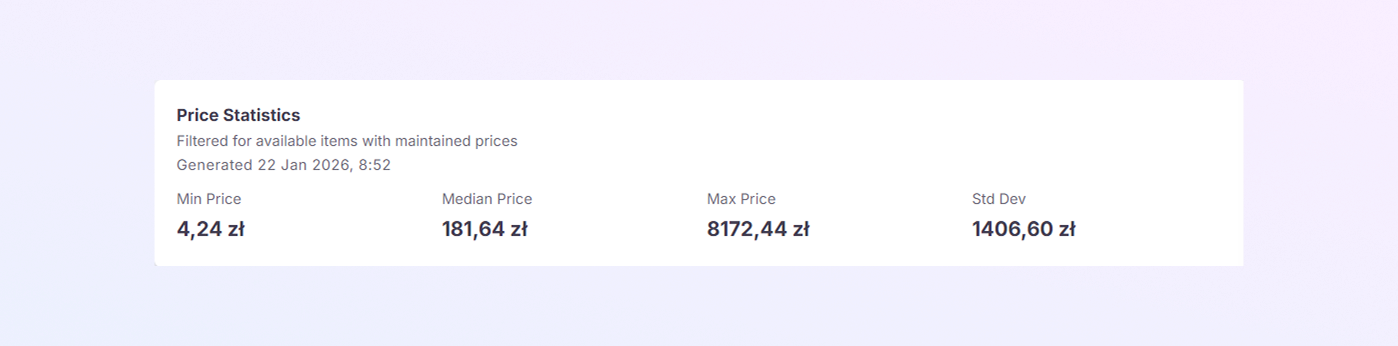
Your inventory's basic price analysis is displayed in this section. You'll see:
-
Min Price: The item with the lowest purchase price.
-
Median Price: The middle amount of all purchase prices
-
Max Price: Highest purchase price.
-
Std Dev (Standard Deviation): Shows how much prices vary across items. Greater price differences correspond to higher values.
Helpful in understanding risk levels and price spreads.
Inventory Items Table
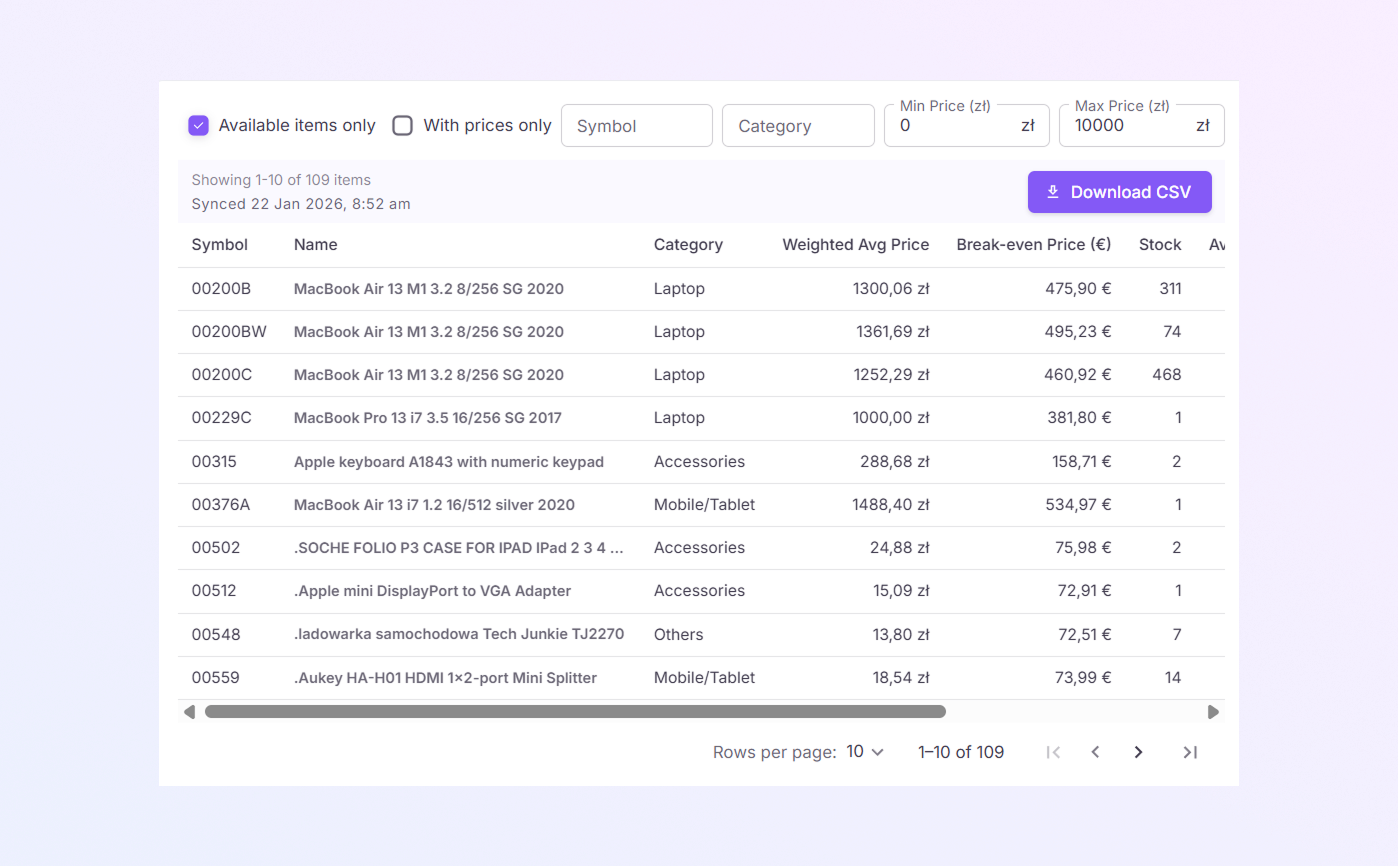
The most important section of the page is the Inventory Items Table, which provides detailed cost and stock information for each product.
-
Symbol: Unique product or SKU identifier.
-
Name: Product name.
-
Category: Product category (e.g., Laptop, Accessories, Mobile/Tablet).
-
Weighted Avg Price: Average purchase price based on quantity bought.
-
Break-even Price: Minimum selling price required to avoid loss.
-
Stock: Total stock quantity.
-
Available: Stock available for sale.
-
Reserved: Stock already reserved for orders.
-
Fetched At: Date and time when the data was last updated.
This table helps you track the real cost per product, avoid selling below cost, and understand stock availability.
Filters & Controls
The following controls can be used to refine the table:
-
Search by Symbol: Find a specific SKU quickly
-
Category Filter: View items from a specific category only.
-
Min Price / Max Price: Filter products by cost price range.
-
Availability Toggle: Show only available items.
-
With Prices Only: Hide items without purchase prices.
-
Download CSV: Export the table data for Reports, Analysis, and Sharing with teams.
Price Distribution Section
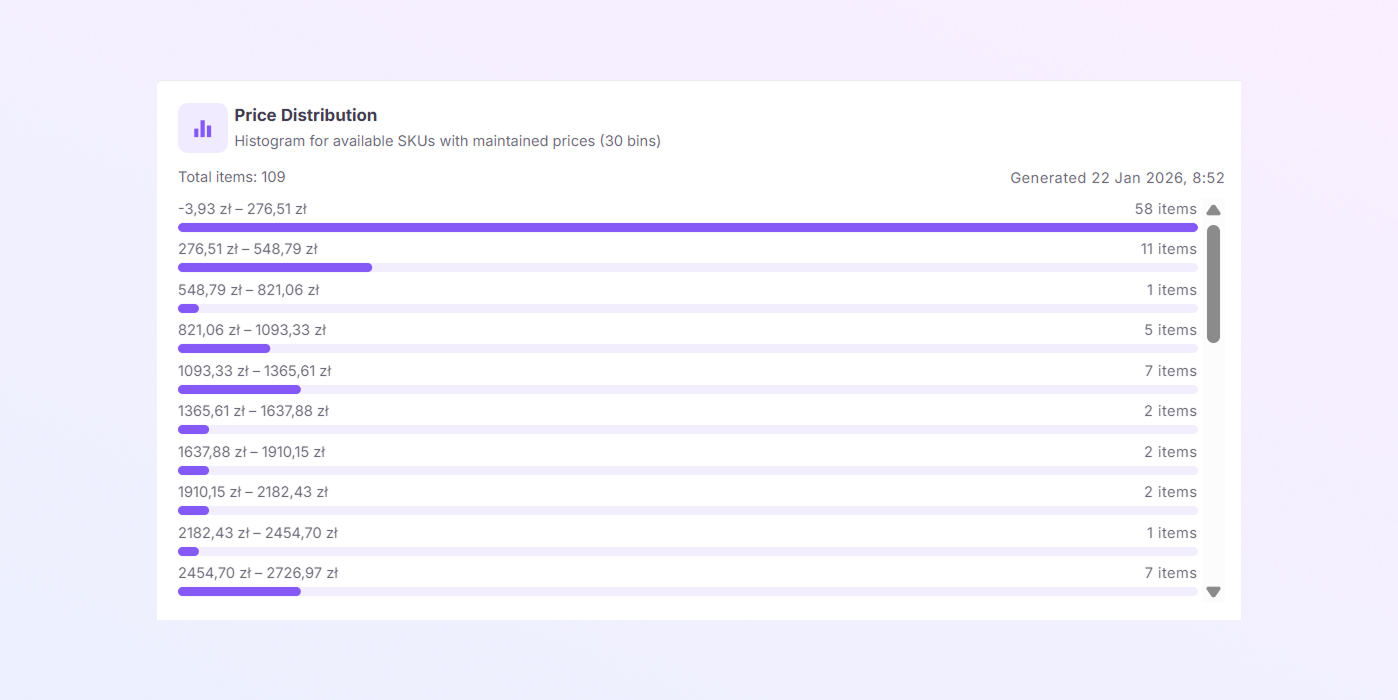
This section displays a horizontal bar chart of price ranges.
-
Price ranges
-
Quantity of items in each price range
It assists you in identifying low-cost versus high-cost products, determining where most inventory cost lies, and balancing your pricing strategy.
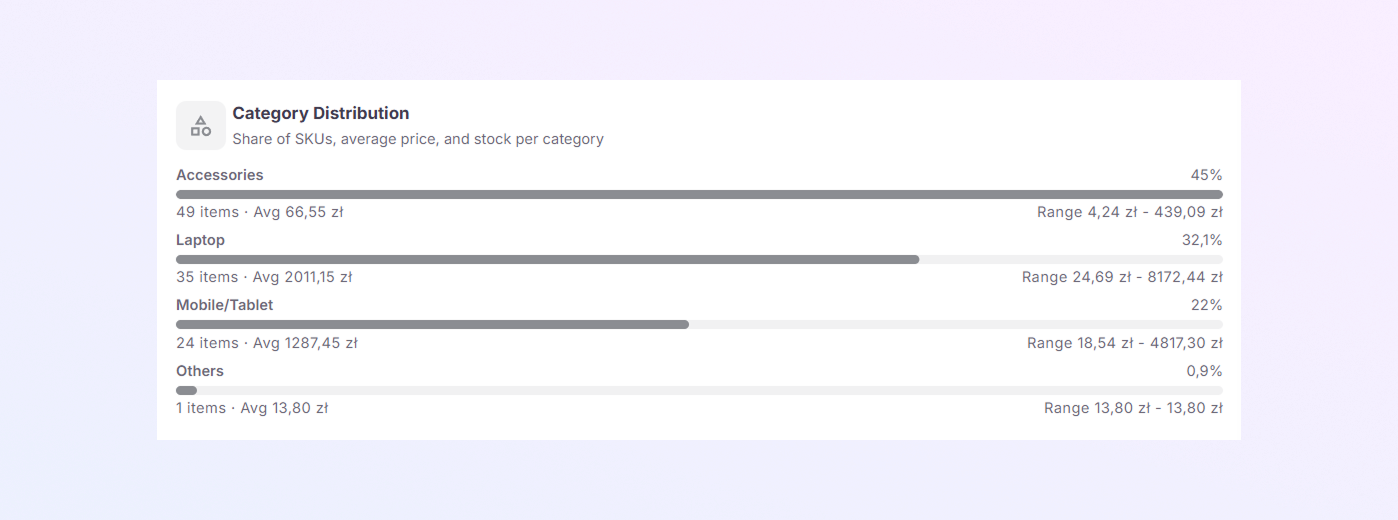
Category Distribution Section
Inventory is displayed by category in this section. For each category, you can see:
-
The quantity of items
-
Average cost of purchase
-
Comparing categories visually
Helpful for cost analysis at the category level, determining which categories are more valuable, and strategic planning and promotion.